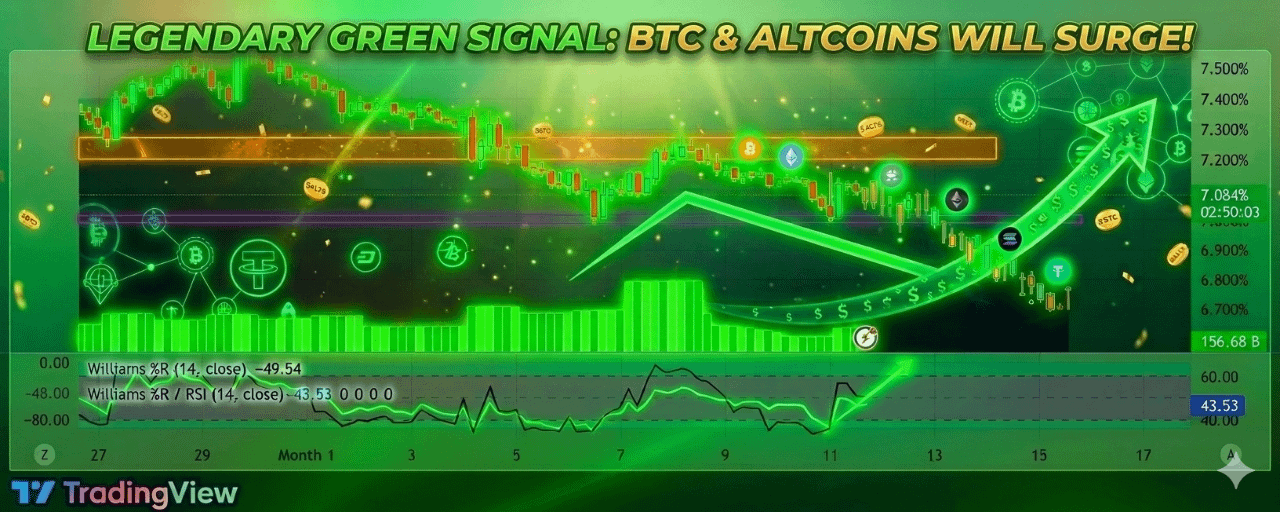
USDT.D Breaks Key Support: A "Green" Signal for the Whole Market
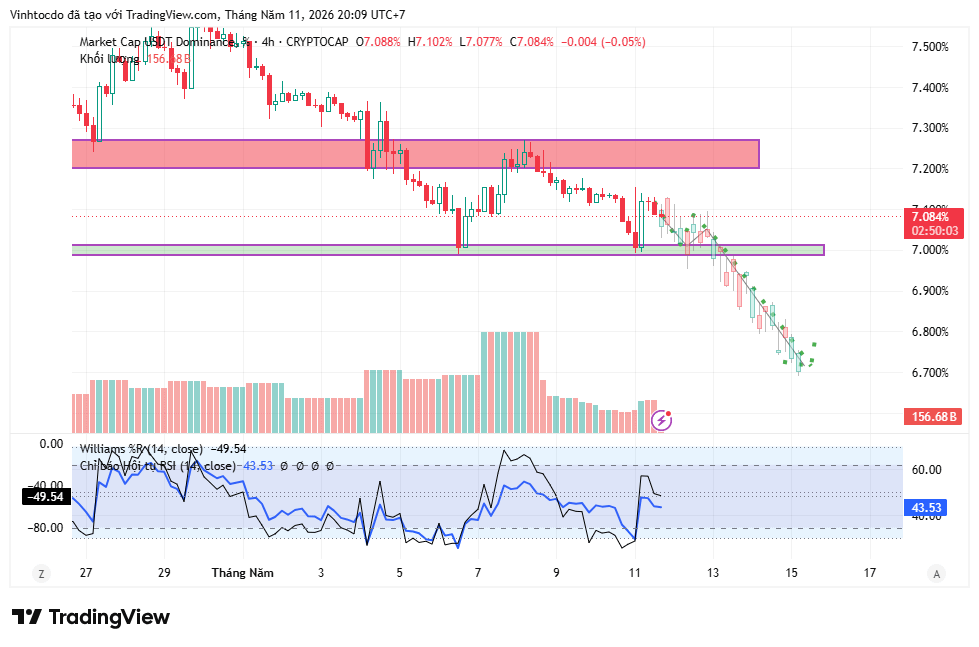
The market cap dominance chart of USDT (USDT.D) is showing a strong decline after breaking the psychological support around 7.00%. In the crypto market, USDT.D typically moves inversely to the price of BTC and Altcoins. When this index drops, it means investors are using stablecoins to scoop up coins.
🔍 Detailed Analysis from the Chart:
The collapse of the bullish structure: After a period of sideways movement and attempts to hold the 7.20% - 7.30% range, USDT.D has officially "broken" support. The continuous red candlesticks with long bodies indicate significant selling pressure of USDT to switch to risk assets.
Confirming the bearish trend: Breaking through the purple zone (around 7.00%) is a turning point. Currently, this index is plummeting towards the 6.70% range with no signs of stopping.
Technical indicators:
RSI: Currently at 43.53 and heading down, indicating that the downtrend of USDT.D still has room, meaning the upward momentum of BTC/Altcoins is still "hot."
Volume: Trading volume reached 156.68B, showing that money flow in the market is very active.
🚀 Impact on BTC and Altcoins:
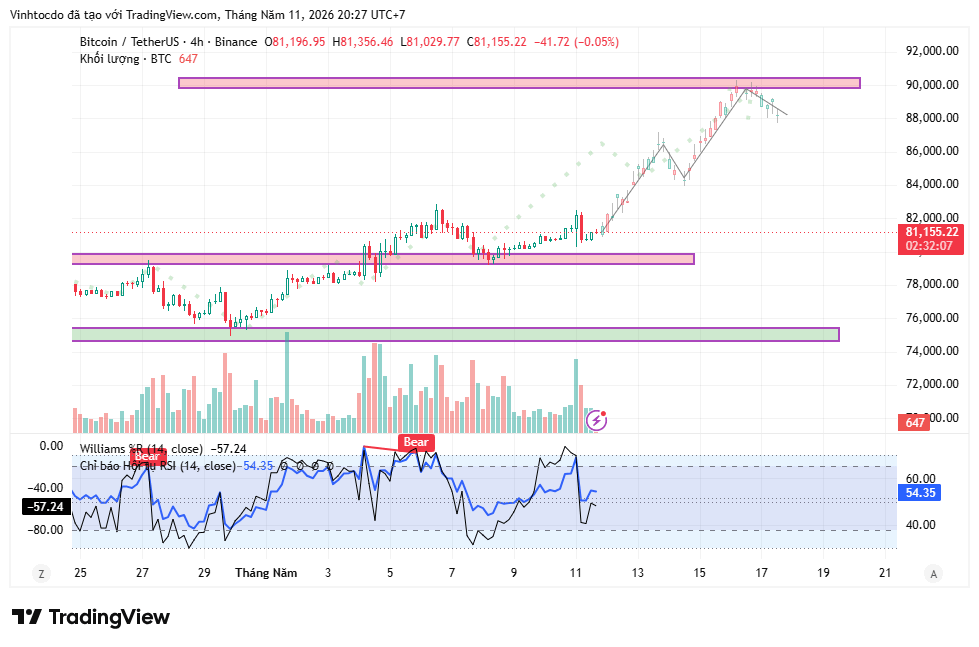
For Bitcoin ($BTC): When USDT.D drops sharply, BTC is often the first destination for the money flow. With this structure, the target of $86K - $95K, as previously analyzed, is becoming more realistic than ever. The drop of USDT.D is the fuel for Bitcoin's breakout.
For Altcoins: This is the "dream scenario" for Altcoin Season. When USDT.D decreases, the risk-on sentiment rises. After BTC stabilizes at high prices, the money flow will flood into top Altcoins and then mid-caps, creating strong green candlesticks.
💡 Trading Advice:
Don't fear the pull-back: In a deep downtrend of USDT.D, its slight rebounds are just opportunities for the market to "retest" before continuing to rise.
Watch the 6.50% zone: This could be the next resting point for USDT.D. When this index hits the deeply oversold zone, that's when we should consider taking some profits.
Conclusion: Looking at this chart, the "money flow map" is pointing straight towards growth. Stay patient with your position and manage your risk well. Big opportunities are ahead! 🚀🔥
This is personal opinion, not financial advice. #DYOR🟢
#CryptoAnalysis #USDTdominance #AltcoinSeason #tradingStrategy


