Hat (TL;DR) — We had a once-promising asset (GIGGLE/USDC). But the book dynamics shifted to distribution: oversupply, weak absorptions, muted rebounds. We therefore canceled 'too high' purchases, freed up $7k, and repositioned a low net + rotation towards buyer DOM setups. This educational note explains why (theory), how (procedure), and when (measurable triggers) we adapt.
1) Concession → Pivot
We all love to 'let the winners run.' Concession: when an asset rises, the temptation is strong to stagger purchases above in case it 'takes off' again. But if the DOM (Depth of Market) deteriorates, these orders become dormant capital with low expectations. Our rule: it’s not hope that dictates, it’s the flow.
2) Simple metaphor (for non-mathematicians)
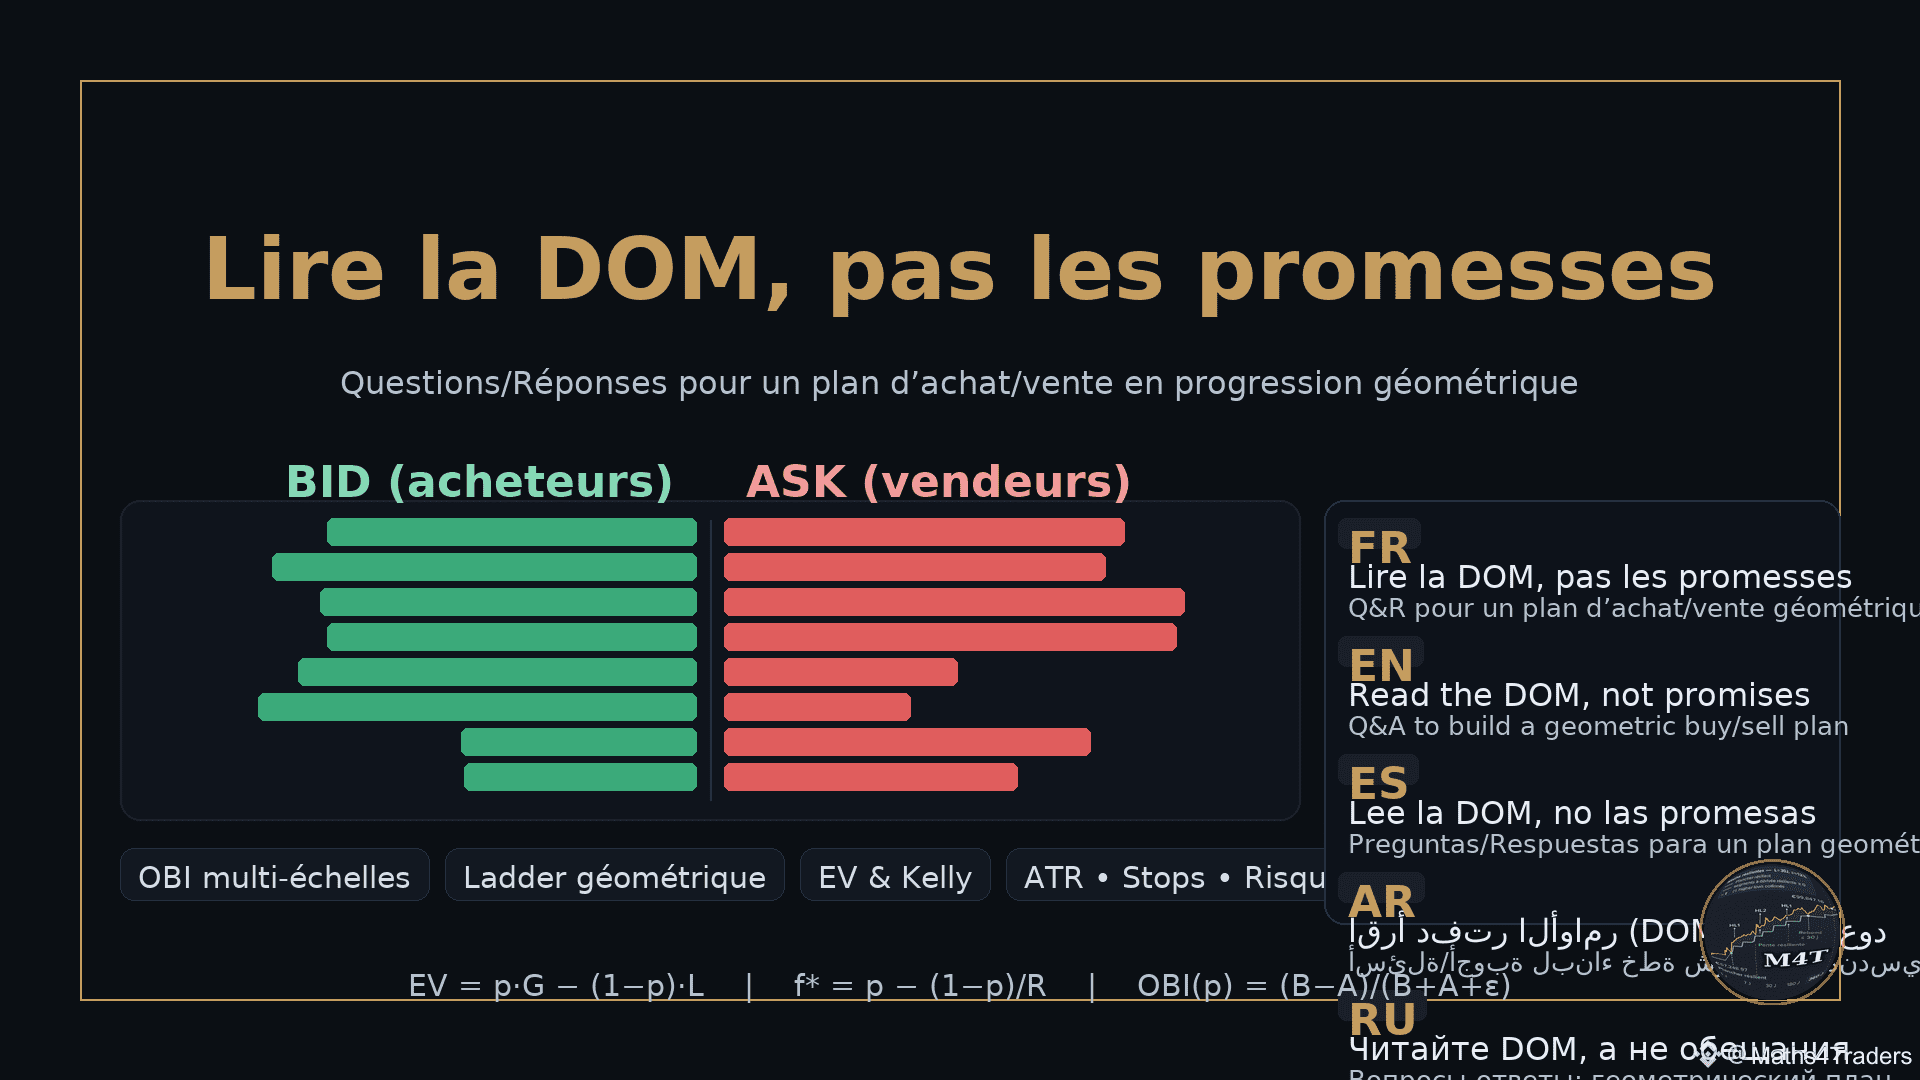
Imagine a theater scene: on the left, buyers (bids) raising their hands, on the right, sellers (asks) lowering the curtain. A successful bullish piece is: more hands going up near the stage, and a curtain that retreats as soon as it's brushed. A distributive piece is: hesitant audience on the left, heavy curtain advancing on the right where every attempt to elevate is stifled.
Q1 — Why read the DOM rather than the price?
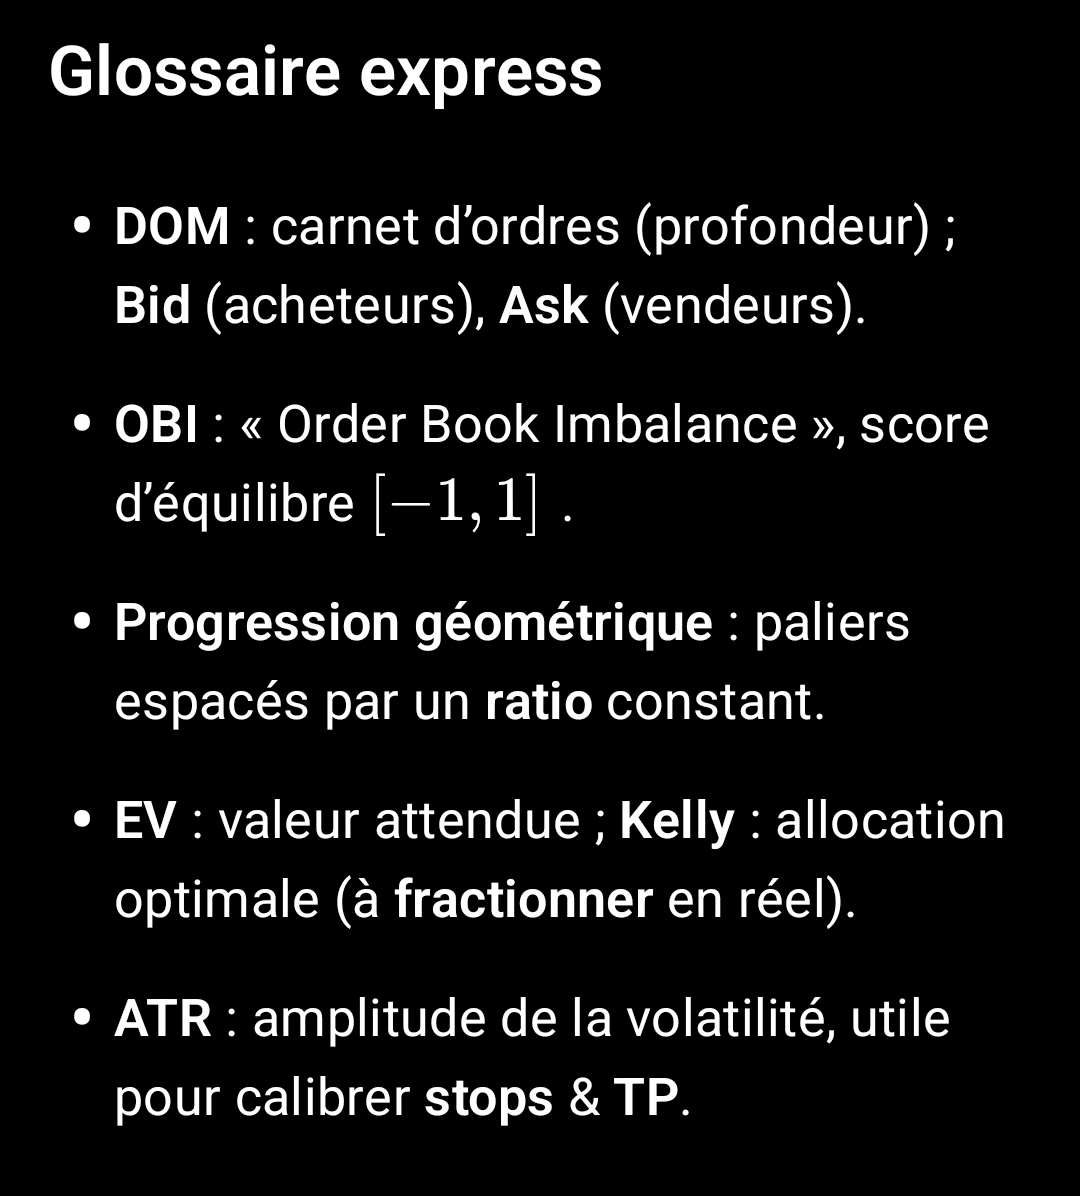
R — Price is an outcome. The DOM shows potential pressure before execution: buy/sell walls, liquidity holes, sentiment shifts at multiple scales around the mid.
3) Theoretical bricks (short version)
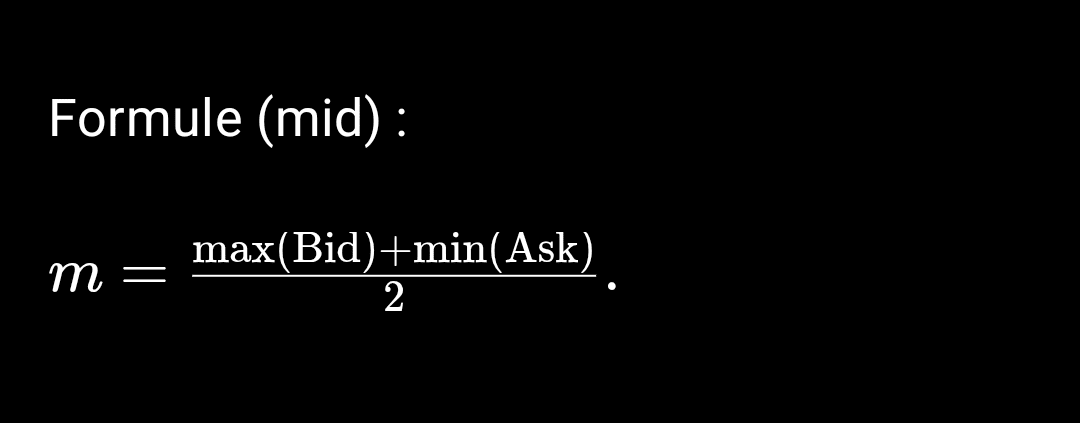
Mid-price: .
Q2 — How to measure 'who is pushing'? (OBI multi-scales)
We add bid and ask liquidity in a relative window around m (mid higher).
OBI at scale p % ('Order-Book Imbalance'):
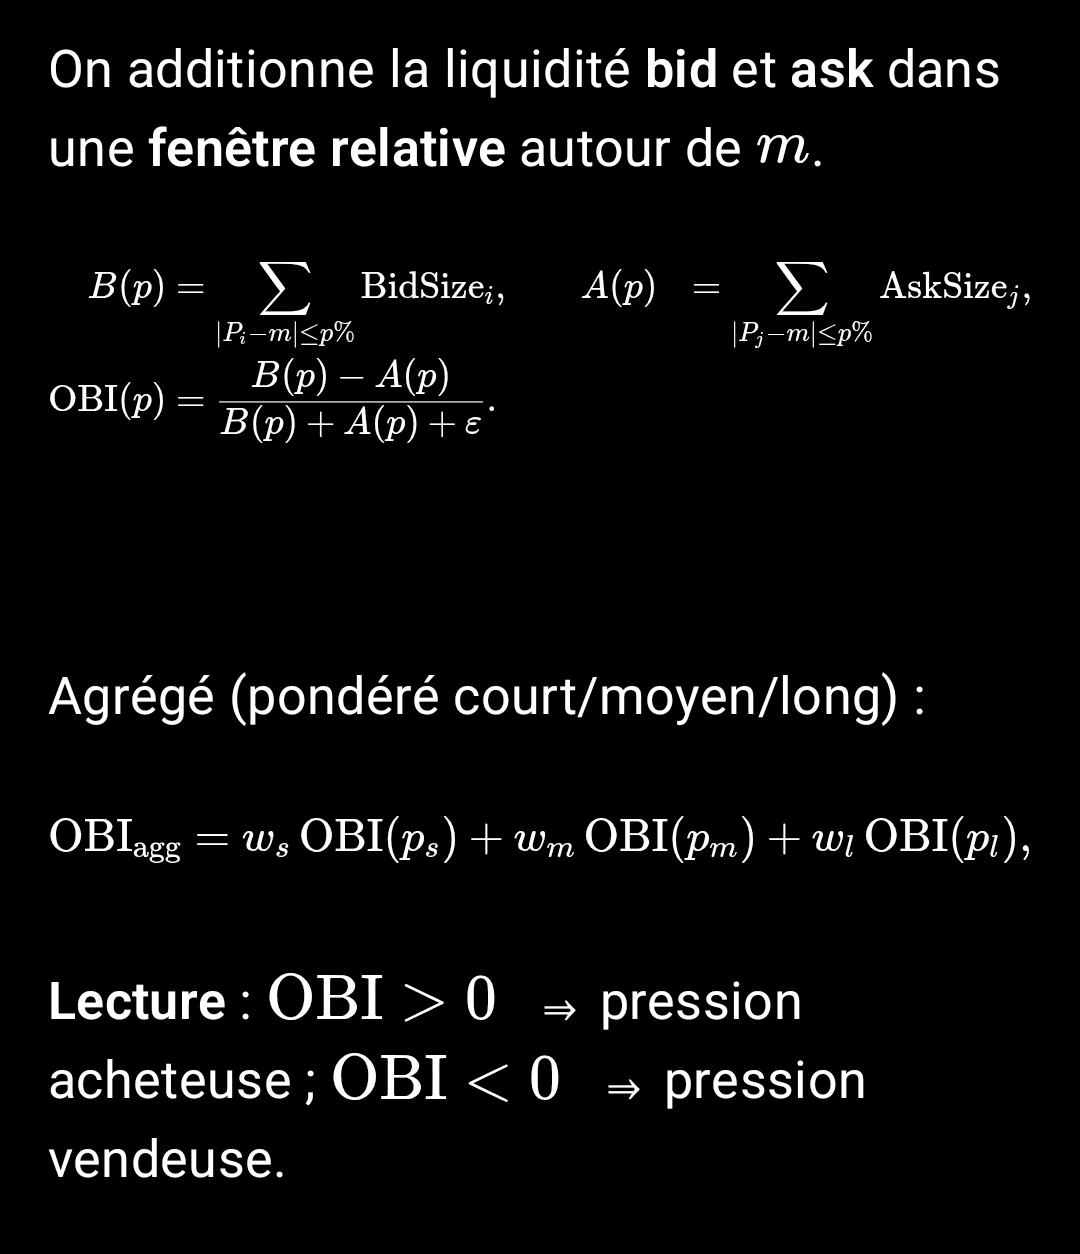
Reading: OBI > 0 ⇒ buying pressure; OBI < 0 ⇒ selling pressure. Continuity > a few minutes ⇒ strong signal.
Bridge with our 'Resilient Maths': we follow the resilient derivative at scale L (strong slope over L windows with noise attenuation). A supported DOM that does not break the resilient floor reinforces the bullish bottom hypothesis; the reverse calls for reducing exposure.
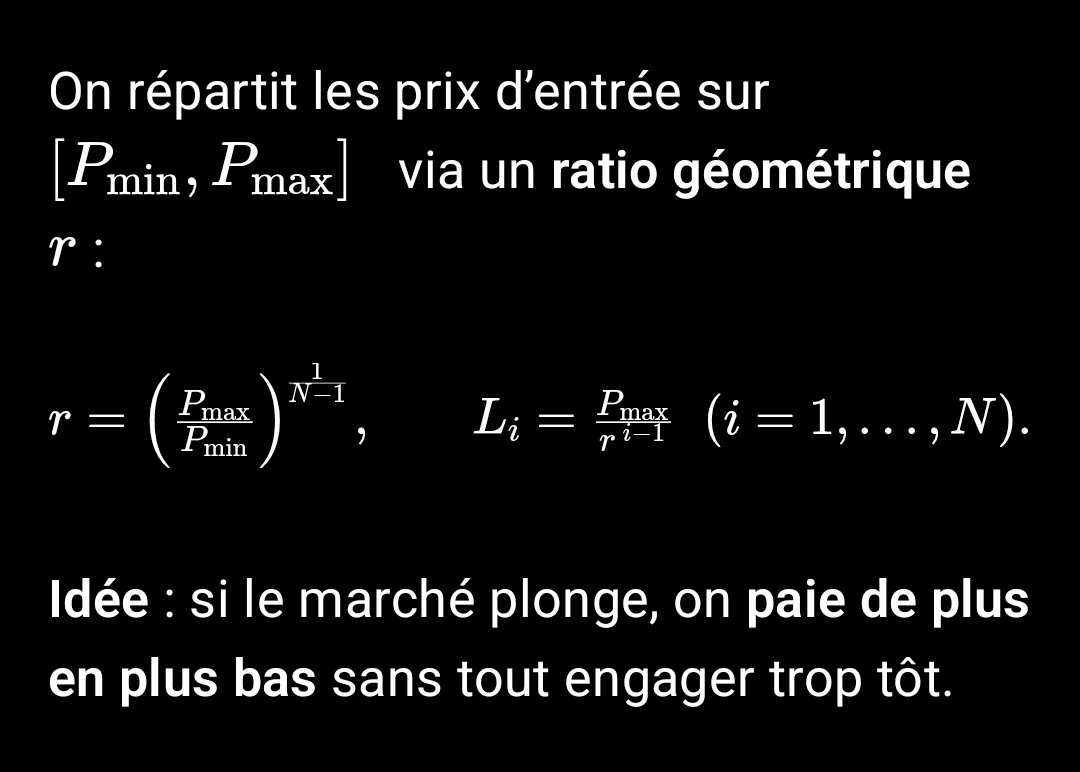
Q3 — How to space N thresholds between two prices (geometric progression)?
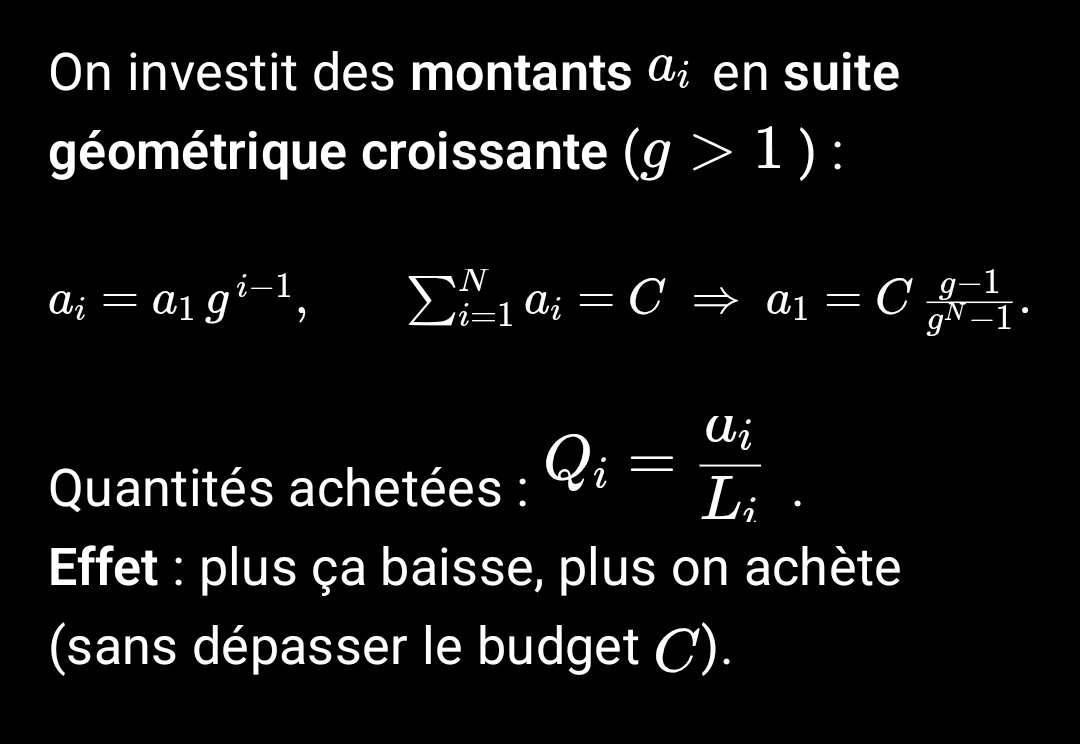
Q4 — How to intelligently overweight the lower end of the range?
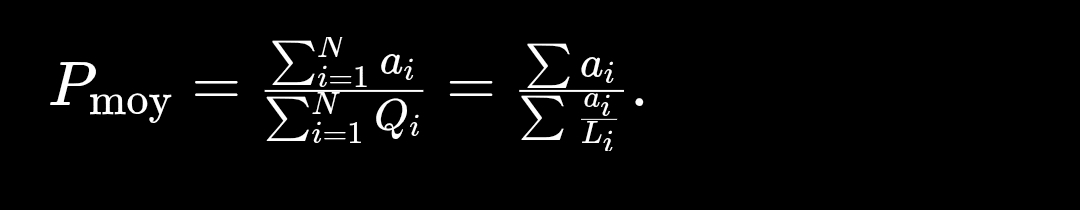
Q5 — What average purchase price (PMA) do we get?
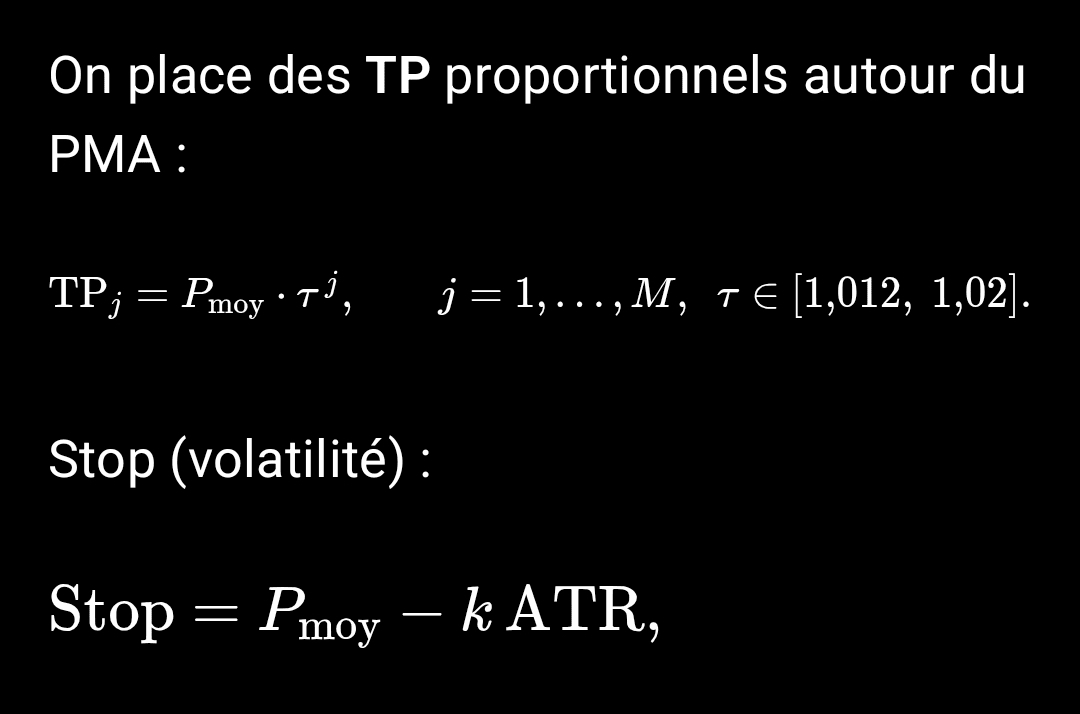
Q6 — How to cash out safely (staggered exits)?
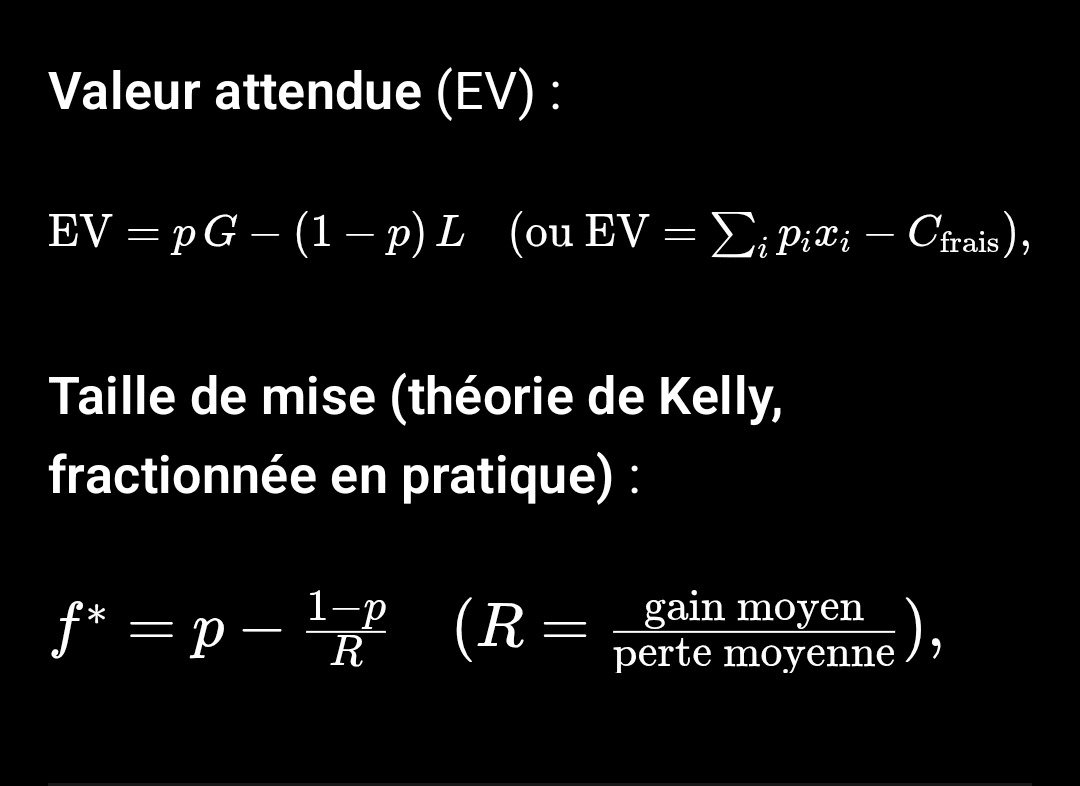
Q7 — How to decide 'act or wait' (EV and Kelly)?
Q8 — Practical procedure (Spot Binance)
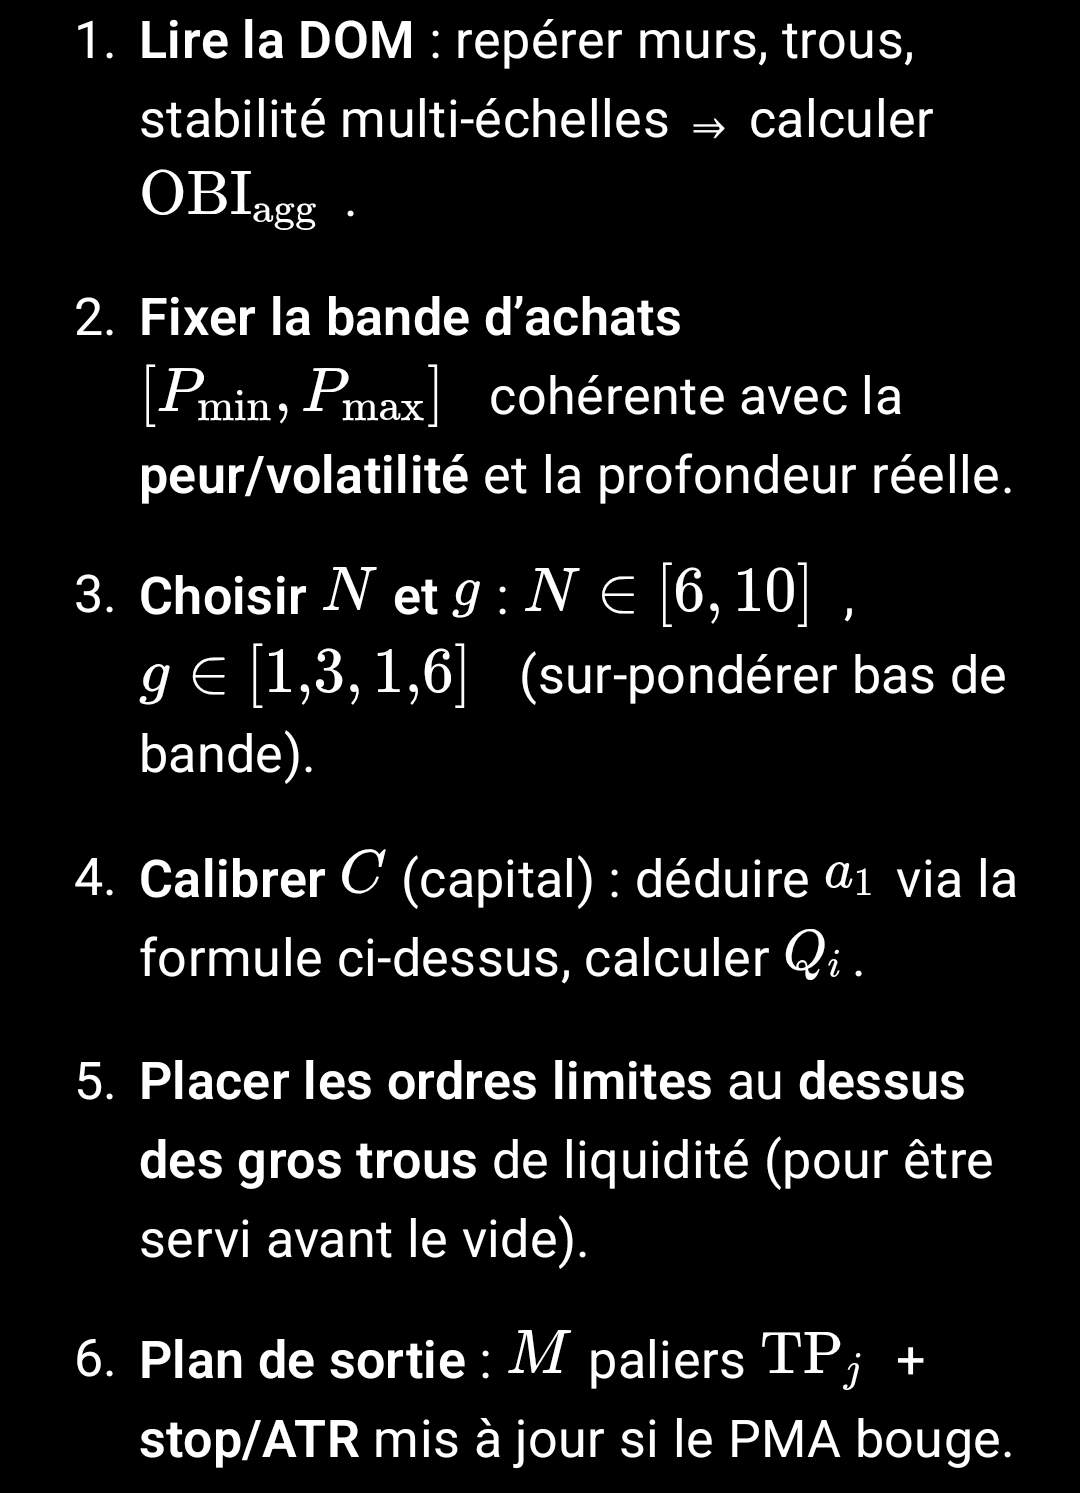
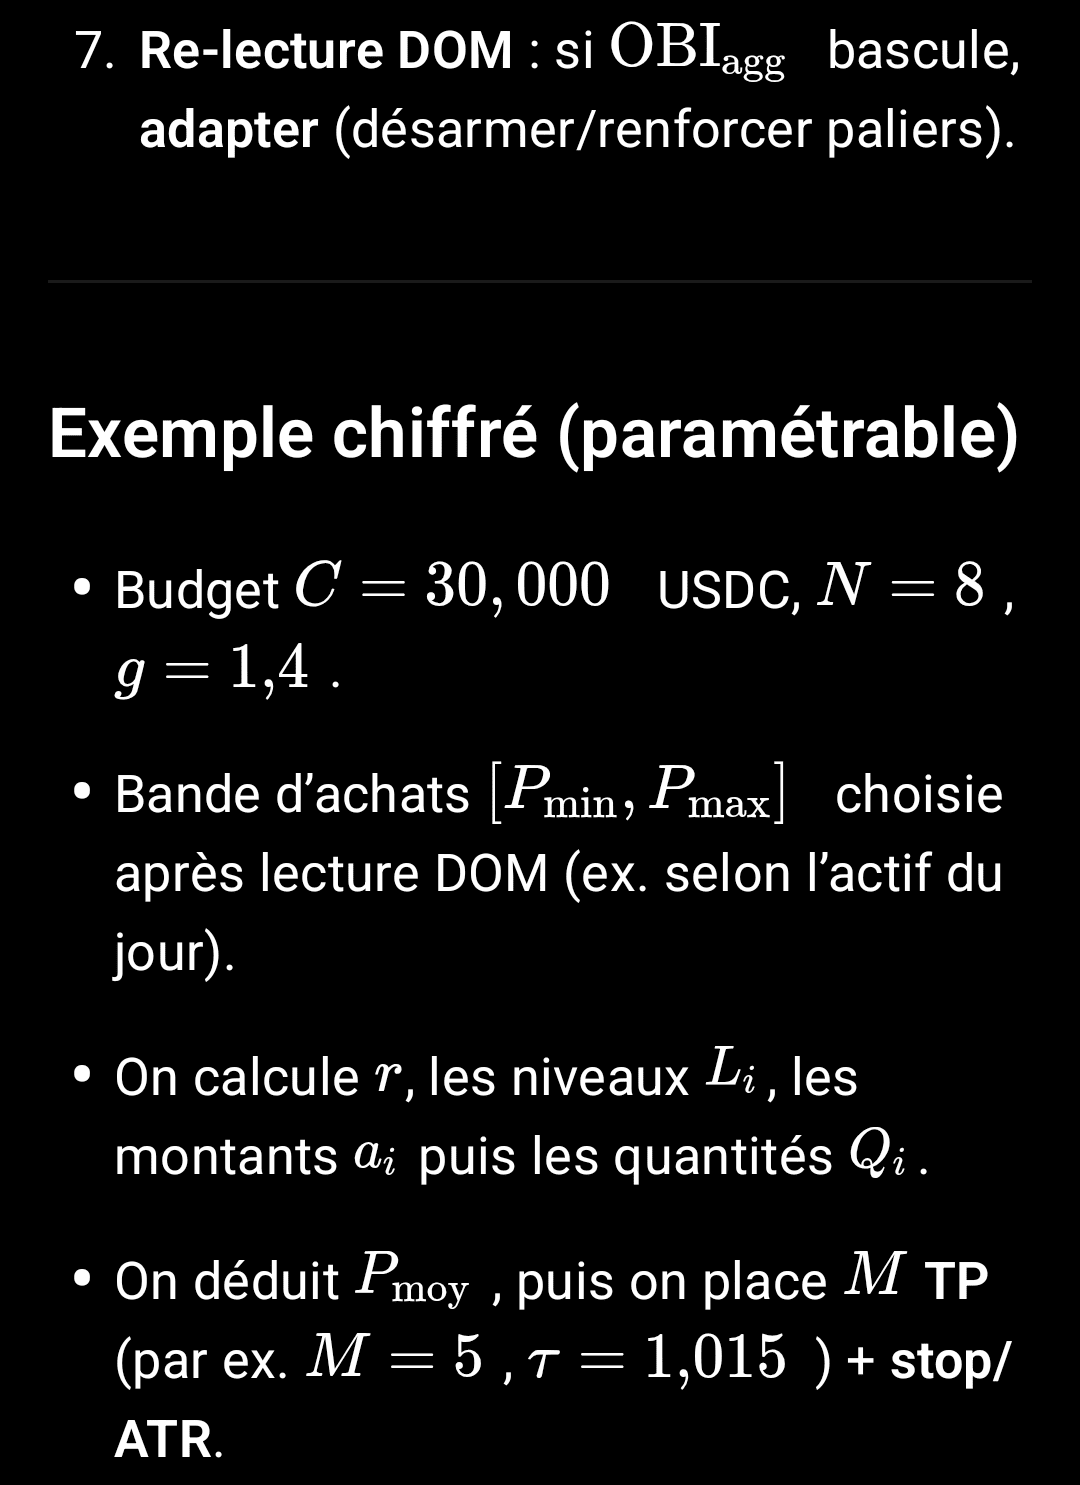
4) Operational procedure (check-list)
A. Observation (live)
1. Open the Binance WebSocket depth + trades.
2. Measure
3. Look at the shape of the order book: ask-walls in staircase? bid refill after sweep? spread tightening?
B. Decision
Short DOM: visible bid refill, dominant green prints → allow staggered purchases above support.
Bear/distribution: , heavy ask-walls, stifled rebounds → cancel 'high' purchases, keep only a low net in small sizes.
C. Execution
Tight scale if fresh signal (close thresholds, increasing sizes towards support).
Capital thermostat: exposure proportional to and to the resilient slope.
5) Case study: $GIGGLE / $USDC (nov.)
Empirical observation (captures and live tracking):
Ask-walls piled above the price, thin bid on several zooms.
OBI often negative and buyer refill insufficient after each sweep.
Short rallies, absorption on the offer side, 2 h candle below median band average.
Action: cancellation of buy orders > 41 USDC, release of 7 k$. Maintaining a low net (e.g., 35/33/31/29) in modest sizes + rotation of capital towards positive DOM setups.
Result: capital re-mobilized, overpay risk reduced, optionality preserved if extreme wick.
6) When to re-enter higher?
Reactivate thresholds above 40 only if 3 confirmations align:
1. Closures > key technical level (e.g., median BOLL 2 h) held.
2. Visible bid refill after a sweep (not just a simple filled hole).
3. several minutes, prints predominantly buyers.
7) Risk framework
By asset: ≤ 25% of bankroll. By threshold: 1–4%.
Time-stop: if the DOM becomes persistently negative, lighten up without remorse.
News/volatility: widen thresholds and reduce sizes if spikes.
8) Fun frame: 'The false wall'
The seller wall at 170 that seems insurmountable... until it evaporates when buyers show up. Tip: don't just look at the wall size, observe its reaction when we tap into it. A real wall grows upon contact; a false wall retreats or disappears.
9) Annexes – Pseudo-code OBI (JS)
function computeOBI(book, mid, pct){
const d = mid * pct / 100;
let bid = 0, ask = 0;
for (const [p,q] of book.bids) if (p>=mid-d && p<=mid+d) bid+=q;
for (const [p,q] of book.asks) if (p>=mid-d && p<=mid+d) ask+=q;
return (bid-ask)/(bid+ask+1e-9);
}
const obiAgg = 0.5*OBI(0.03)+0.35*OBI(0.30)+0.15*OBI(1.50);
10) Prescriptions
Observe the DOM at 3 scales.
Compare the aggregated OBI to threshold ±0.05.
Track the bid refill after sweep.
Avoid piling up 'high' purchases when supply dominates.
Quickly reallocates to buyer books.
11) Two questions to anchor
Are we buying evidence (flow) or a story (hope)? And if the flow changes tomorrow, does our plan change automatically?
12) Virtuous closure
Let's stay disciplined: let the DOM numbers choose for us. The humility to adapt is worth more than the pride of being 'right'. 🤝