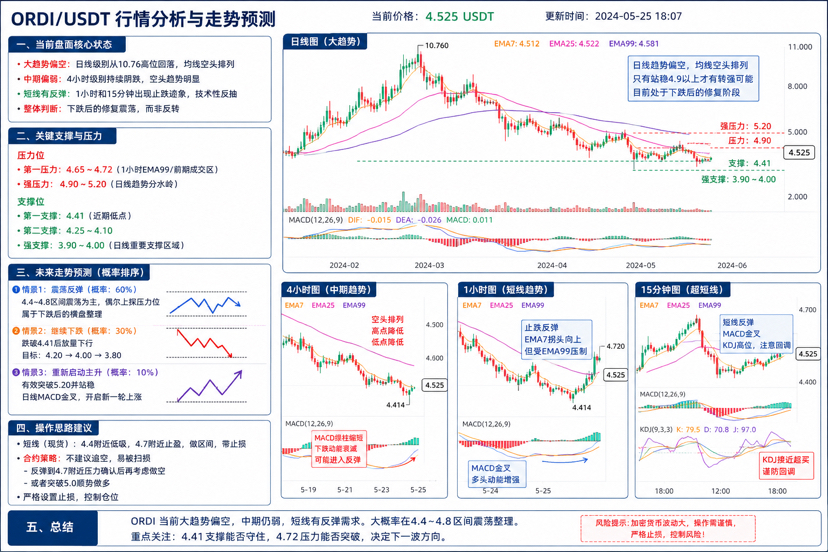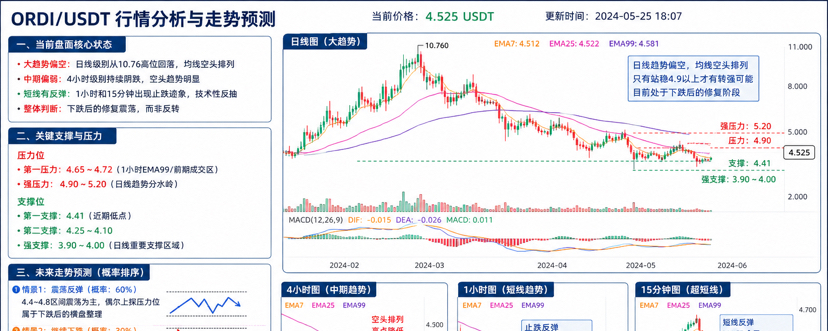
Previously surged from around 2 to 10.76
Now entering a prolonged pullback
Current price is around 4.52
This indicates that:
1. The major rally phase has come to an end
We've already transitioned from the 'main uptrend' into:
Distribution at high levels
Consolidation for offloading
Value regression phase
The daily EMA7 has crossed below EMA25:
EMA(7) < EMA(25)
We're looking at a mid-term bearish structure.
And the MACD:
MACD < 0
We've also re-entered a weak zone.
So:
The daily trend is currently bearish
Unless we reclaim above:
4.9
5.2
5.5
Otherwise, it will be tough to regain strength.
2. 4-hour level (most critical for short to mid-term)
Your 4-hour chart is very clear:
Continuous bearish trend appears.
Characteristics:
EMA7 is below EMA25.
EMA25 is below EMA99.
Bearish arrangement forms.
This is typical:
Bearish trend.
Structurally:
Highs keep decreasing:
5.8
5.4
5.0
4.7
Lows are also continuously decreasing.
Indicates:
Funds are still continuously flowing out.
But there's a positive signal.
MACD green bars shrinking:
MACD \to 0
Means:
Bearish momentum is fading.
Possible short-term rebound.
But note:
This doesn't mean a reversal.
Currently more like:
Technical rebound after overselling.
Three, 1-hour level (short-term trend).
1-hour here:
Signs of a bottoming out have appeared.
You can see:
4.414 marks a temporary low.
Followed by continuous small gains.
EMA7 starts to turn.
Indicates:
Short-term has funds bottom fishing.
But the problem is:
EMA99 is still being suppressed around 4.72.
This means:
4.7~4.8 is strong resistance area.
If it rebounds here but volume doesn't increase:
It could easily drop again.
Four, 15-minute level (ultra-short term)
15-minute currently belongs to:
Small-scale rebound structure.
Characteristics:
MACD golden cross.
KDJ high position.
EMA7 just crossed above EMA25.
Short-term is biased towards rebound.
But:
KDJ is approaching overbought:
K > 80
So:
Likely to spike first.
Then oscillate again.
Five, Key Support and Resistance.
Support level.
First support.
4.41
This is the recent low.
Break below:
Possible to go to:
4.25
4.10
Strong support.
3.90~4.00
This is an important area on the daily level.
If the market is weak:
This area is likely to be tested.
Resistance level.
First resistance.
4.65~4.72
This is:
1-hour EMA99
Previous high volume trading area.
Strong resistance.
4.9~5.2
This is the dividing line of the daily trend.
Only if it reestablishes stability:
Only then will it be considered truly strong.
Six, Future Trend Predictions (Key Point)
Scenario 1: Oscillation rebound (highest probability).
In the next few days, it's highly likely that:
4.4~4.8 range consolidation.
Occasional spikes.
Slow recovery.
Belongs to:
Consolidation after a drop.
This is currently the healthiest trend.
Scenario 2: Continued drop (second probability).
If:
BTC/Ethereum pullback.
ORDI volume breaks below 4.4.
Then:
Next target:
4.2
4.0
3.8
Will test the lows again.
Scenario 3: Restarting the major uptrend (current probability is low).
Must meet:
Condition 1.
Reestablish stability:
4.9
Condition 2.
Volume breakout:
5.2
Condition 3
Daily MACD re-golden cross.
Otherwise:
No major upward trend visible for now.
Seven, Operational Thoughts (Practical).
If you're short-term.
Can pay attention to:
Buy the dip around 4.4.
Take profit around 4.7.
Trade the range.
But must include stop loss.
If you're in contracts.
Currently:
Not suitable for chasing shorts.
Because it has already dropped significantly.
Easier to:
Choppy losses.
Spike rebound.
A better strategy.
Wait:
Confirm resistance around 4.7.
Then consider going short.
Or:
Volume breakout at 5.0.
Ride the trend long.
Eight, A one-sentence summary.
ORDI current:
Overall trend is bearish.
Mid-term is still weak.
Short-term has rebound demand.
Currently more like:
"Recovery consolidation after a drop."
And not the start of a new bull run.
Focus on short-term:
Can 4.41 hold?
Can 4.72 break?
These two positions determine the next wave's direction.