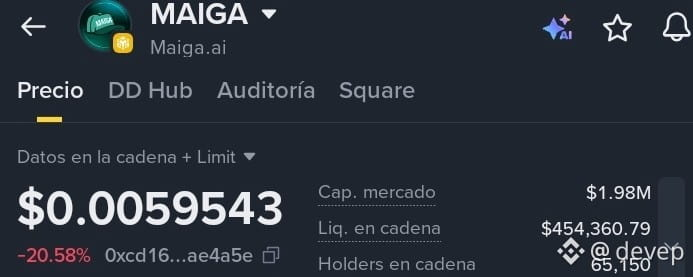
Hey everyone in the community! Today we're closely monitoring $MAIGA (Maiga.ai) after noticing some interesting movements in the last few hours. As always, aiming for precision in our recovery plan.
15m Analysis (Scalping/Short-term):
The chart shows a sharp drop from $0.0091, but heads up: we've just seen a significant technical bounce after hitting support at $0.00499.
RSI(6): It's recovering ground at 49.50, moving out of an extreme oversold zone where we saw clear exhaustion of selling pressure.
Moving Averages: The price is struggling to stay above the MA(7) ($0.0057). If it manages to consolidate this level, the next technical target would be to aim for the MA(25) around $0.0065.
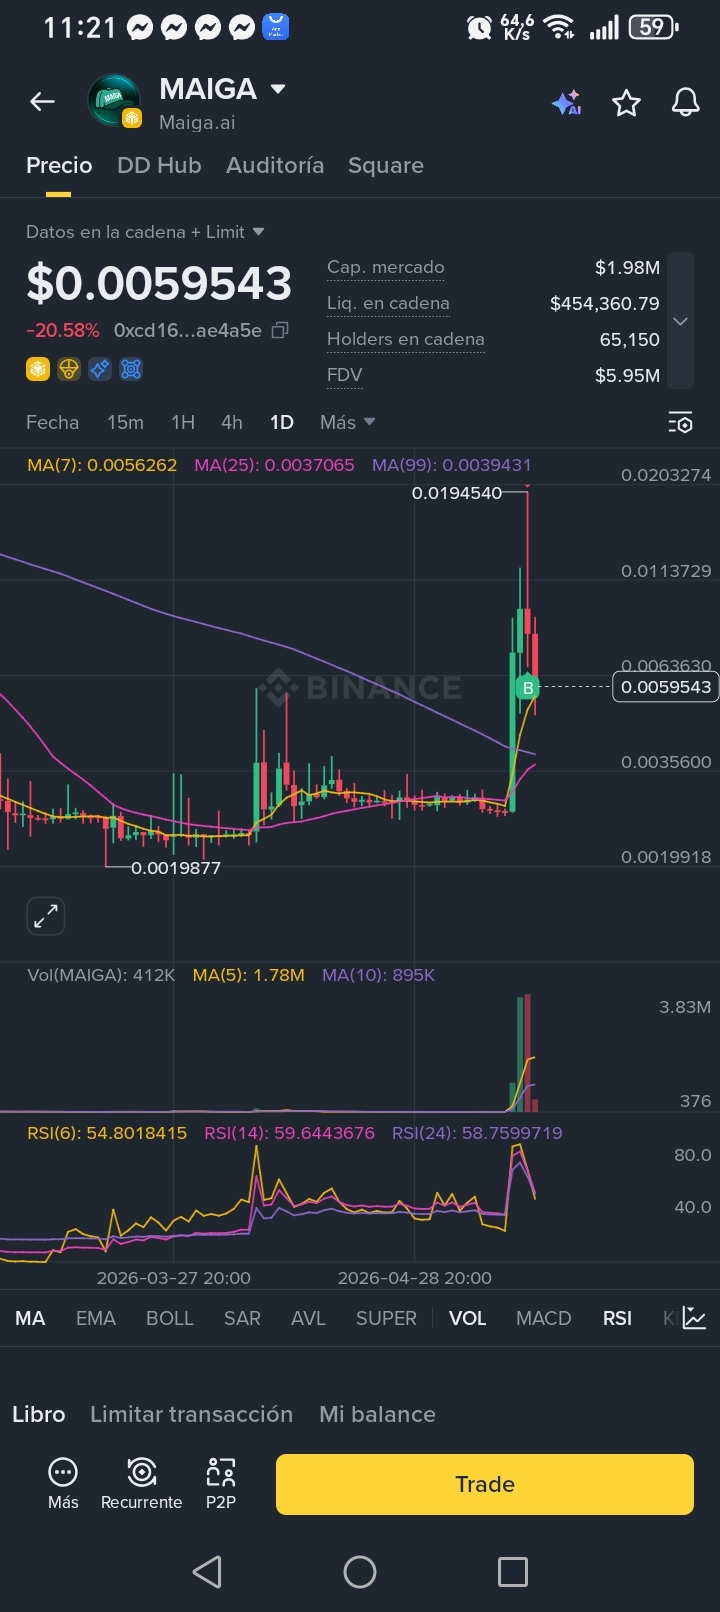
Macro View (1D Chart):
Despite the recent -20% correction, on the daily chart we see that $MAIGA is testing previous liquidity zones. Market cap remains at $1.99M with liquidity at $454K, making it highly volatile.
For those of us looking for high-probability entries:
1. Confirmation: Wait for buyer volume to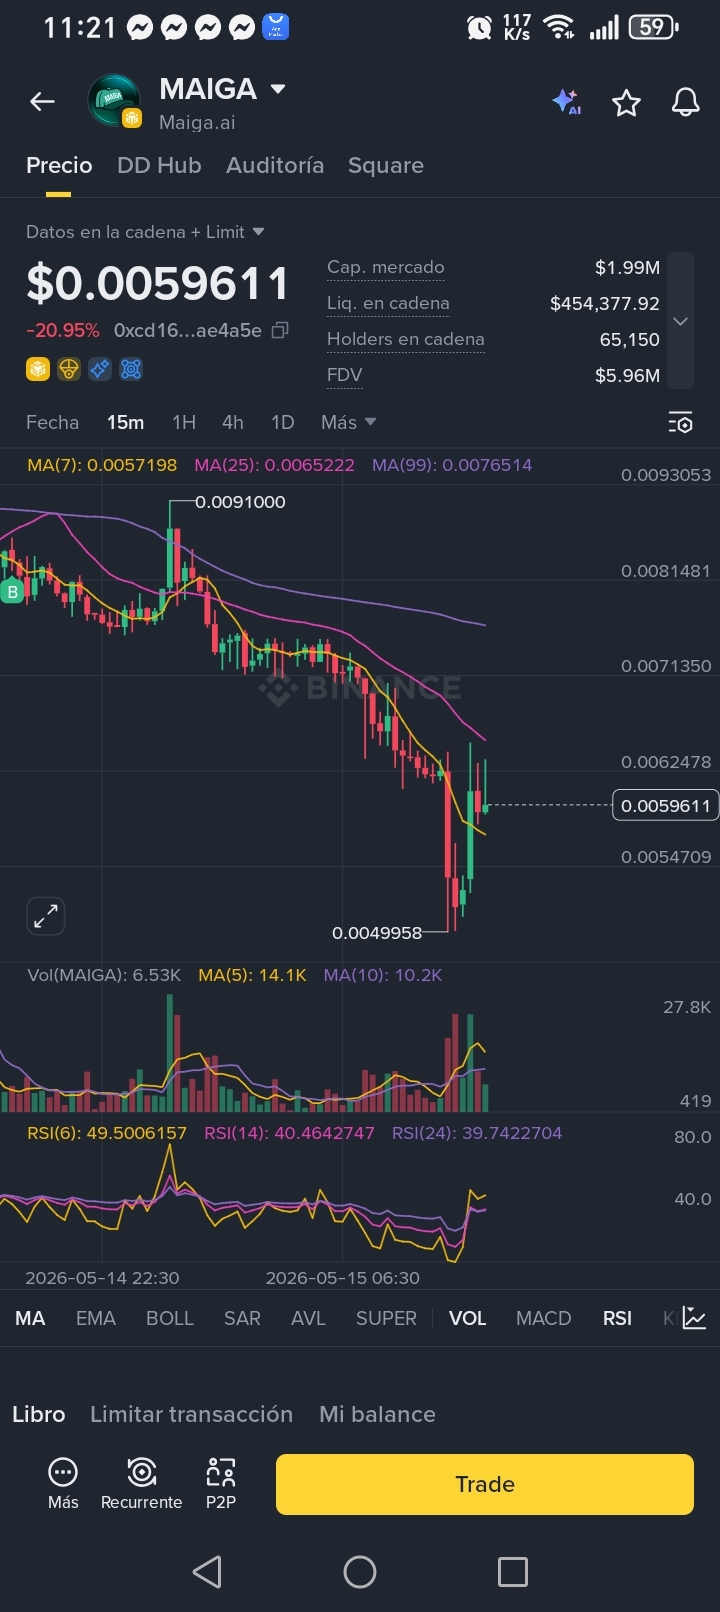
 hold the current support.
2. Risk: Strict management. Volatility is high and any BTC movement could impact the structure.
What do you all think? Is it a bear trap or the start of a bullish reversal? Looking forward to your thoughts in the comments! 👇
#MAIGA #CryptoTrading #TechnicalAnalysis #BinanceSquare #TradingTips #Web3