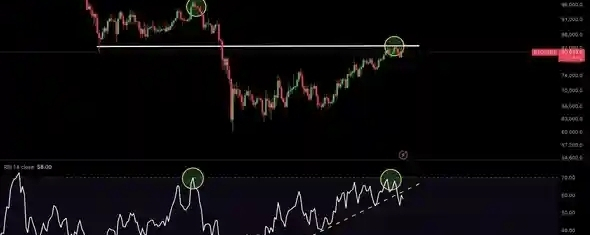
Hey there, fellow traders and future millionaires! 💸 If you're currently watching the chart and think the current uptrend is safe, I advise you to stop right there and reconsider. The attached chart for the BTC/USDT pair on the daily timeframe (1D) is sending a very clear warning signal that only the pros can see. Let's analyze the hidden magic in this picture:🔍 Chart Breakdown: Bear Trap or Bull Trap?Resistance of the previously broken white line (Support turned Resistance): The price has dropped hard in the past and broke key support levels. Now, it's coming back to test that same horizontal white line (around the 83k - 85k levels) but this time as a strong resistance. The price is clearly struggling to break through and close above it (the green circular shadows).The biggest secret: Hidden Bearish Divergence ⚠️: On the price chart: the current peak (right peak) is lower than the previous peak (left peak). A drop in peaks. On the Relative Strength Index (RSI): the indicator has reached the same previous overbought levels (above 70) and is almost forming a peak that is equal to or relatively higher with a strained upward trend line.The result: this contradiction means the current buying momentum is weak and is being pushed slowly, paving the way for a "sharp correction" to re-liquidate the futures (Long Liquidation).🎯 Expected Whale Scenario: Whales are gathering liquidity now. The inability to break through the horizontal resistance firmly and with huge trading volume will mean a tactical drop to re-test the intermittent upward trend line on the RSI and the lower price support.$XRP $ETH
💬 Drop your thoughts in the comments: Do you think the whales will break through resistance and push towards a new all-time high? Or are we going to see a corrective dip soon? 👇👍 Smash that like if you dig the analysis.🔄 Share to warn your friends.➕ Follow to be the first to catch the upcoming whale moves before everyone else! #Bitcoin #BTC #TechnicalAnalysis #BinanceSquare #WhaleAlertBTCETH