🧭 First: Understanding the overall picture on the hourly timeframe (1h)
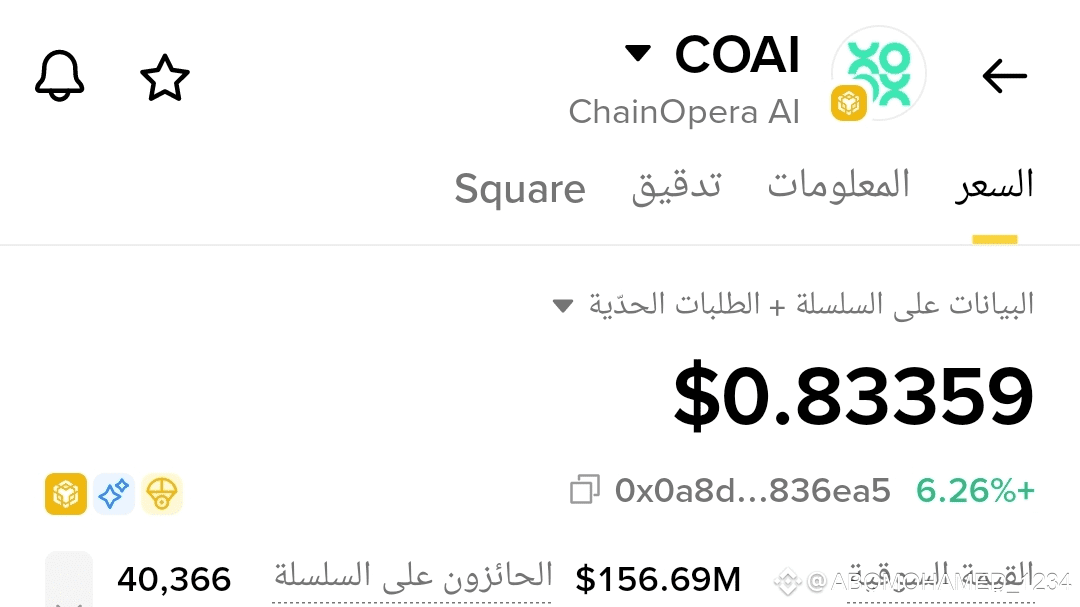
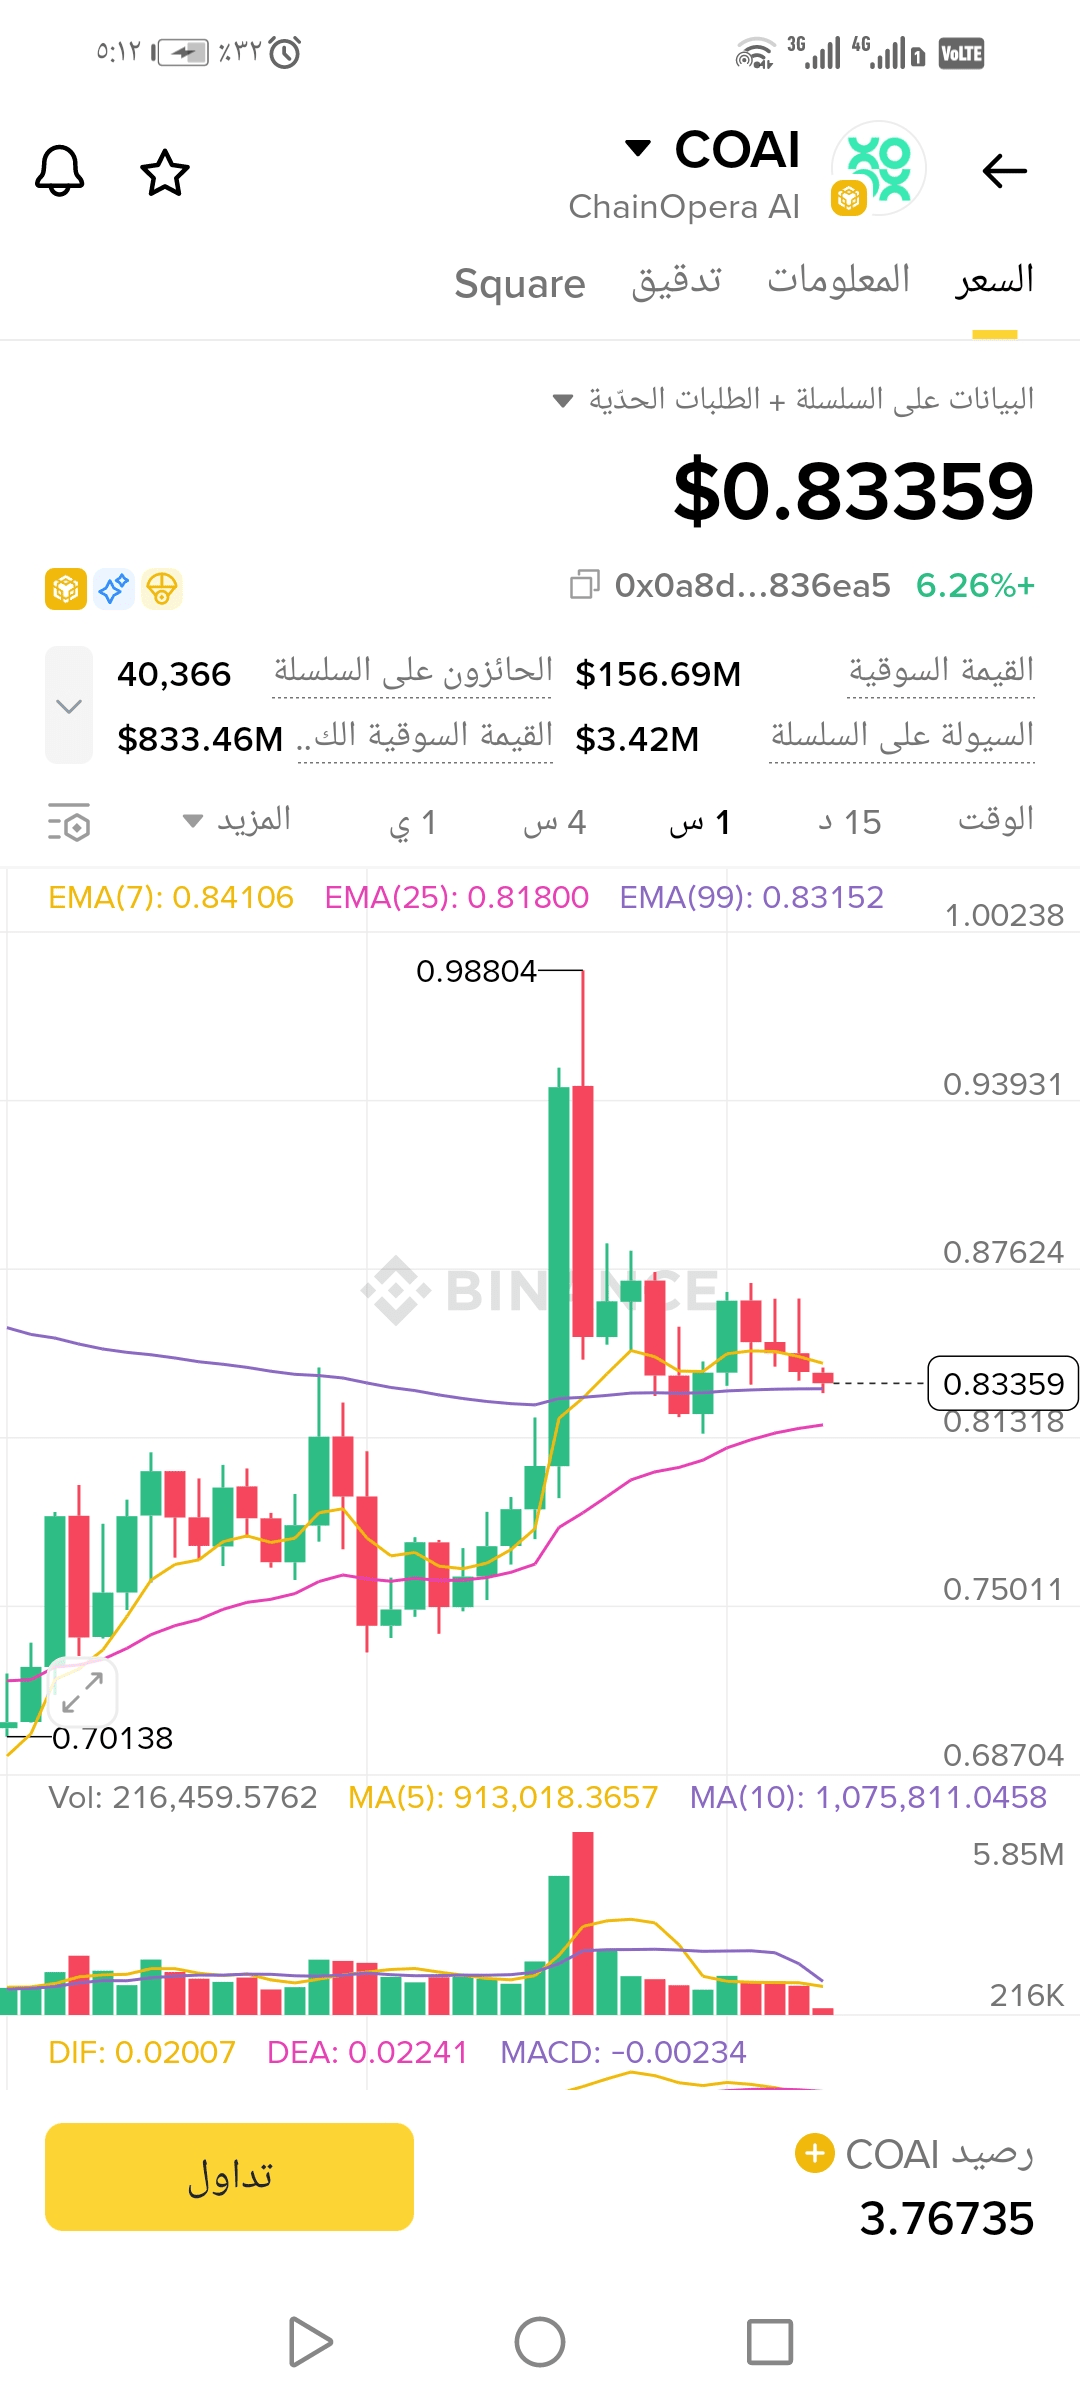
The COAI currency is currently moving at $0.83359 after a corrective decline from the peak of 0.98804. The movement is now within a narrow consolidation range reflecting a balance of power between buyers and sellers, but with a clear tendency for sellers to dominate in the short term.
🔥 Second: Reading Japanese candlesticks with very high accuracy
📉 1. Recent candles show:
Small candles (small body) ➜ Indicate hesitation and weak momentum of the trend.
Clear upper tails 🔴 ➜ Evidence of selling pressure whenever the price tries to rise.
Consecutive red candles 🟥 with a few green ones 🟩 ➜ Indicate that the market is gradually losing buying power.
📌 What does that mean?
The currency is undergoing a cooling phase after a strong upward wave, and the market is waiting for a break or a collapse to determine its next direction.
📊 Thirdly: Analyzing technical indicators accurately
🟡 1. EMA 7 average
at 0.84106
➜ price is below it 🔻
📌 Indicates weakness in momentary momentum and absence of strong buyers.
🟣 2. EMA 25 average
at 0.81800
➜ price is slightly above it
📌 The area between EMA7 and EMA25 is called the pressure or temporary balance area.
🟪 3. EMA 99
at 0.83152
➜ price is touching it now
📌 This is a heavy average... breaking it downwards means the start of a short downward trend.
📉 4. MACD Indicator
DIF: 0.02007
DEA: 0.02241
MACD Histogram: -0.00234 🔻
🟥 What does this mean?
The histogram is negative ➜ selling momentum is increasing.
Bending of the MACD lines downwards ➜ Start of a clear weakening wave.
📦 5. Trading volume (Volume)
Continuous decline in volume 🔻
📌 This is the most important indicator here:
When the price drops with low volume → indicates a correction and not a collapse.
🎯 Expected technical trend for COAI
✔️ Positive scenario (medium probability)
If the price maintains the area of 0.815 – 0.830, a gradual rebound towards will begin:
T1: 0.860
T2: 0.905
T3: 0.950
🟢 This only happens if the price returns above EMA7 + increase in green volume.
❗ Negative scenario (slightly higher probability currently)
If the price breaks 0.813 which is the EMA99 area:
It will drop to 0.780
then 0.750 as a very strong buying area.
🔴 Current indicators lean towards this scenario due to weak momentum.
⭐ Summary of the analysis
COAI is currently in a consolidation and pressure phase after a strong peak.
The candles show clear hesitation, and the indicators show a slight downward bias but without collapse.
The current area is very critical…
Any break above 0.86 will restore strong upward movement,
and any break below 0.813 opens the door for corrective decline.
📝 Very important notes (colored)
🟢 Excellent buying area: 0.780 – 0.815
🔴 Danger and reversal area: break 0.813
🟡 Confirmed entry signal: Hourly candle closes above 0.860
🟣 Beware of weak volume… it is the reason for any failure to rebound.
✍️ Article writer: Hamdy Elbealy 1
#Hamdyelbealy #MarketPullback #BinanceHODLer0G #BinanseSquare
