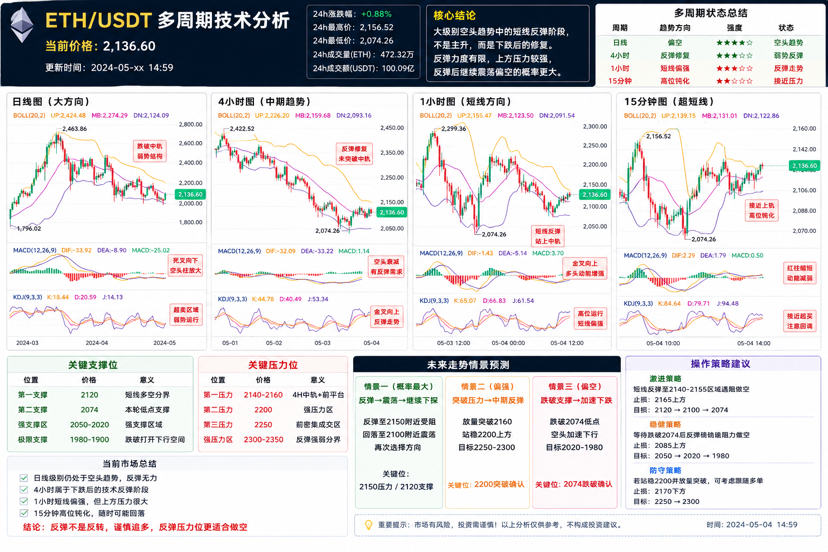
Currently, ETH is in:
"Short-term rebound phase within a major bearish trend."
Not a main rally,
but a correction after the drop.
Let me break it down for you.
1. Daily level (determines the big direction)
This is crucial.
You're looking at the daily chart:
Price 2136
Bollinger middle band 2274
Lower band 2124
Explanation:
ETH has dropped from a bullish zone into a bearish zone.
Moreover:
The daily is continuously running below the Bollinger middle band
MACD dead cross continues to widen
Bearish bars are still expanding
This means:
The main trend on the daily still leans bearish.
Key daily structure
Previous high:
2463
Current price:
Fell all the way to 2074
Explanation:
The market has formed:
"Downward trend".
That is:
Higher highs are getting lower
Lower highs are consistently moving down
This is a typical bearish structure.
Two, 4-hour level (current core)
4-hour now is:
Technical rebound after bearish.
Your current 4-hour status:
The good side
Bounced from 2074 to 2136
MACD starts to shorten the green bars
KDJ golden cross
Indicates:
Short-term bearish weakening.
But the issue is:
Price still:
Not standing on the midline 2159
The upper Bollinger band continues to press down
MA trend still going down
Indicates:
Rebound strength is not enough.
Now can only define:
"Weak pullback"
Not a reversal.
Three, 1-hour level (short-term rhythm)
1 hour is currently the only strong cycle.
You will see:
MACD has golden crossed
Red bars continue
KDJ running at high levels
Price returns above the midline
Indicates:
Short-term funds are snatching rebounds.
But:
Strong pressure at 2145~2160 above
Because:
Here:
Is the previous broken platform
Also the 1-hour Bollinger upper band
So:
It's easy to see:
Spiking and falling back.
Four, 15-minute period (ultra short)
15-minute now:
Has already entered high-level stagnation.
You can see:
KDJ close to 90
MACD red bars shorten
Price close to the upper band
Indicates:
Short-term chasing longs risk is starting to grow.
Current most likely trend:
"After the rebound, continue to oscillate bearish"
Instead of a direct reversal upwards.
Six, key positions (very important)
Upper pressure
First resistance
2140~2160
Here it is:
4-hour midline
Previous platform
Bull-bear dividing line
Second resistance
Near 2200
This is:
The real strong pressure zone.
If it doesn't break 2200,
The larger level is still bearish.
Seven, lower support
First support
2120
Second support
2074
This is the low point of this round.
Strong support
2050~2020
If this level is lost:
ETH may enter:
A new round of accelerated decline.
Eight, the following script is highly likely
Script 1 (highest probability)
Rebound → oscillation → continue to probe down
Trend is roughly:
2130
→ 2150
→ Pull back to 2100
→ Then oscillate
This is currently the most likely.
Script 2 (strong bias)
If:
Volume breakout at 2160
Stabilize above 2200
Then it may:
Open medium-level rebound.
Target:
2250
2300
Script 3 (bearish bias)
If:
Break below 2074
Then:
The daily bearish will continue to release.
Next may:
2020
1980
1900
Will all open.
Nine, the most critical sentence now
ETH currently:
The overall direction is still bearish,
But short-term is bouncing back and repairing.
So:
Not suitable for chasing longs;
More suitable for:
Waiting for a breakout confirmation
OrWaiting for rebound pressure to short.