
Key indicators (May 11, 4 PM HKT → May 18, 4 PM HKT):
BTC/USD is down 4.7% (from $80,800 to $77,000)
ETH/USD is down 9.0% (from $2,330 to $2,120)
BTC/USD Spot Technical Outlook:
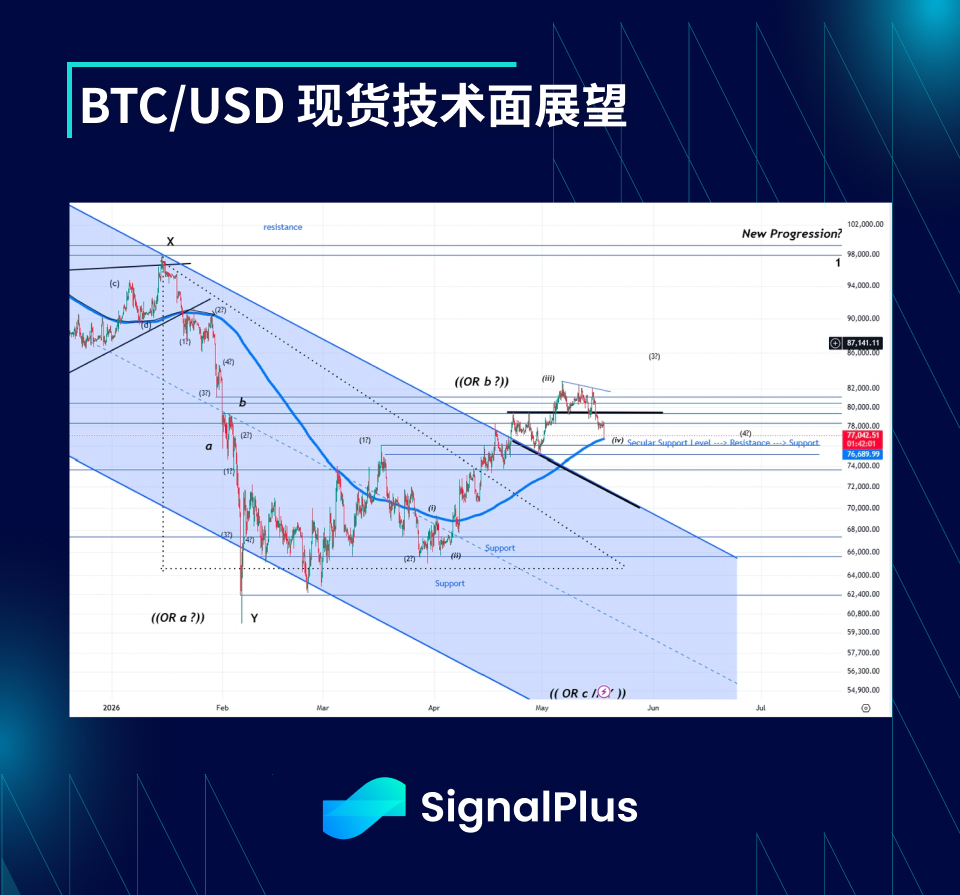
The price action still aligns with characteristics of a wide consolidation phase, with strong support in the 76-75k range, followed by support around 74k. Currently, the next phase post-consolidation is more likely to be an upward breakout to 85-86k, but even if that surge occurs, it’s expected that we’ll enter a longer period of sideways trading afterwards.
• If it breaks below 72-73k, the medium-term trend will become complicated again. As prices continue to operate outside of the previous downward channel, the likelihood of further dips below 60k is decreasing, so what is more likely is a long-term sideways oscillation.
Market Themes
In the latter half of last week, the previously exuberant sentiment in the US stock market finally began to fade. Although Trump and Xi Jinping made some positive statements during their meeting in China, the US-Iran deadlock did not make further progress, and oil prices continued to rise slowly, stabilizing above $100/barrel. This long-term uncertainty and high oil prices ultimately transmitted to the front-end interest rate market, and the narrative of 'the Fed will not raise rates further this year' was gradually undermined by reality, leading to a re-adjustment of pricing. If high rates persist, stock market valuations naturally need to be discounted. However, from the current view, the space for interest rates to rise significantly further is limited, as the last wave of rate increases was clearly triggered by the stop-loss of some structural positions in the market. • In the crypto market, ahead of the (Clarity Act) vote and the Trump-Xi meeting, the market preemptively executed some risk-off operations, and at the beginning of this week, BTC briefly dipped to 79k. Subsequently, as the (Clarity Act) passed in the House and was submitted to the Senate, BTC rebounded to 82k. However, after failing to break through 82k on the third attempt, macro sentiment weakened over the weekend, putting significant pressure on the crypto market. BTC retraced the gains made from the bill's passage, closing last week around 79k, and further dropped below 77k due to weekend liquidation pressure. Overall, macro variables remain relatively stable at the beginning of this week, so if other conditions remain unchanged, there is a possibility of a rebound back to 78-79k (to fill the CME gap) later today. Overall, the market currently has light positions, and stop losses on both long and short sides have been triggered within the wide range of 76-82k.
BTC ATM implied volatility: BTC USD ATM implied volatility (Hong Kong time May 11 at 4 PM → May 18 at 4 PM)
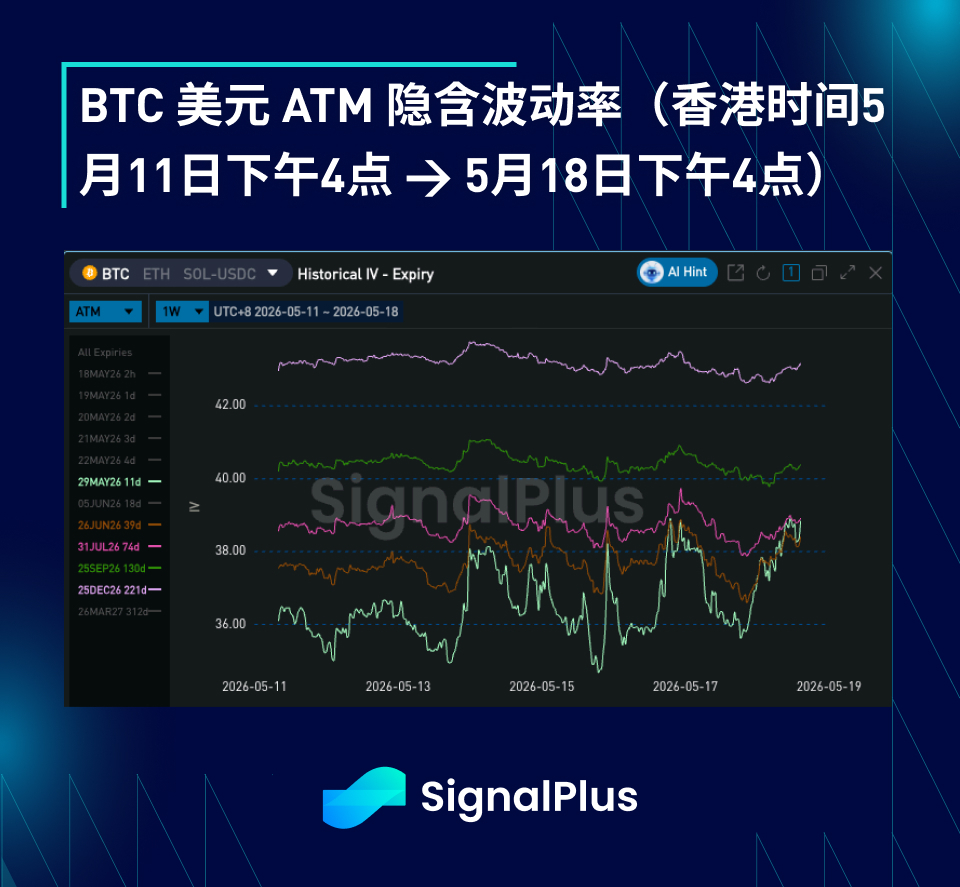
• Last week, the implied volatility overall maintained a sideways trend slightly tilted downward. Although the price volatility range was large (82k-76.5k), the actual volatility remained relatively low. Including the weekend, the high-frequency actual volatility for the week was about 30-31 vol, which is basically consistent with the previous week. Due to the decline in spot prices over the weekend, the implied volatility rebounded somewhat from the lows at the beginning of this week, but overall it has not changed much since mid-last week. • The volatility curve term structure remains very steep, so whenever the spot price fluctuates, the curve tends to flatten rapidly (mainly driven by rising short-end volatility). Across the entire term structure, the selling of structural call options remains abundant, while buying is comparatively scarce (except for some tactical Gamma trades during event-driven or directional breakthroughs). Therefore, the entire term structure continues to face pressure during upward movements.
BTC Skew / Peak: BTC USD 10d peak (Hong Kong time May 11 at 4 PM → May 18 at 4 PM)
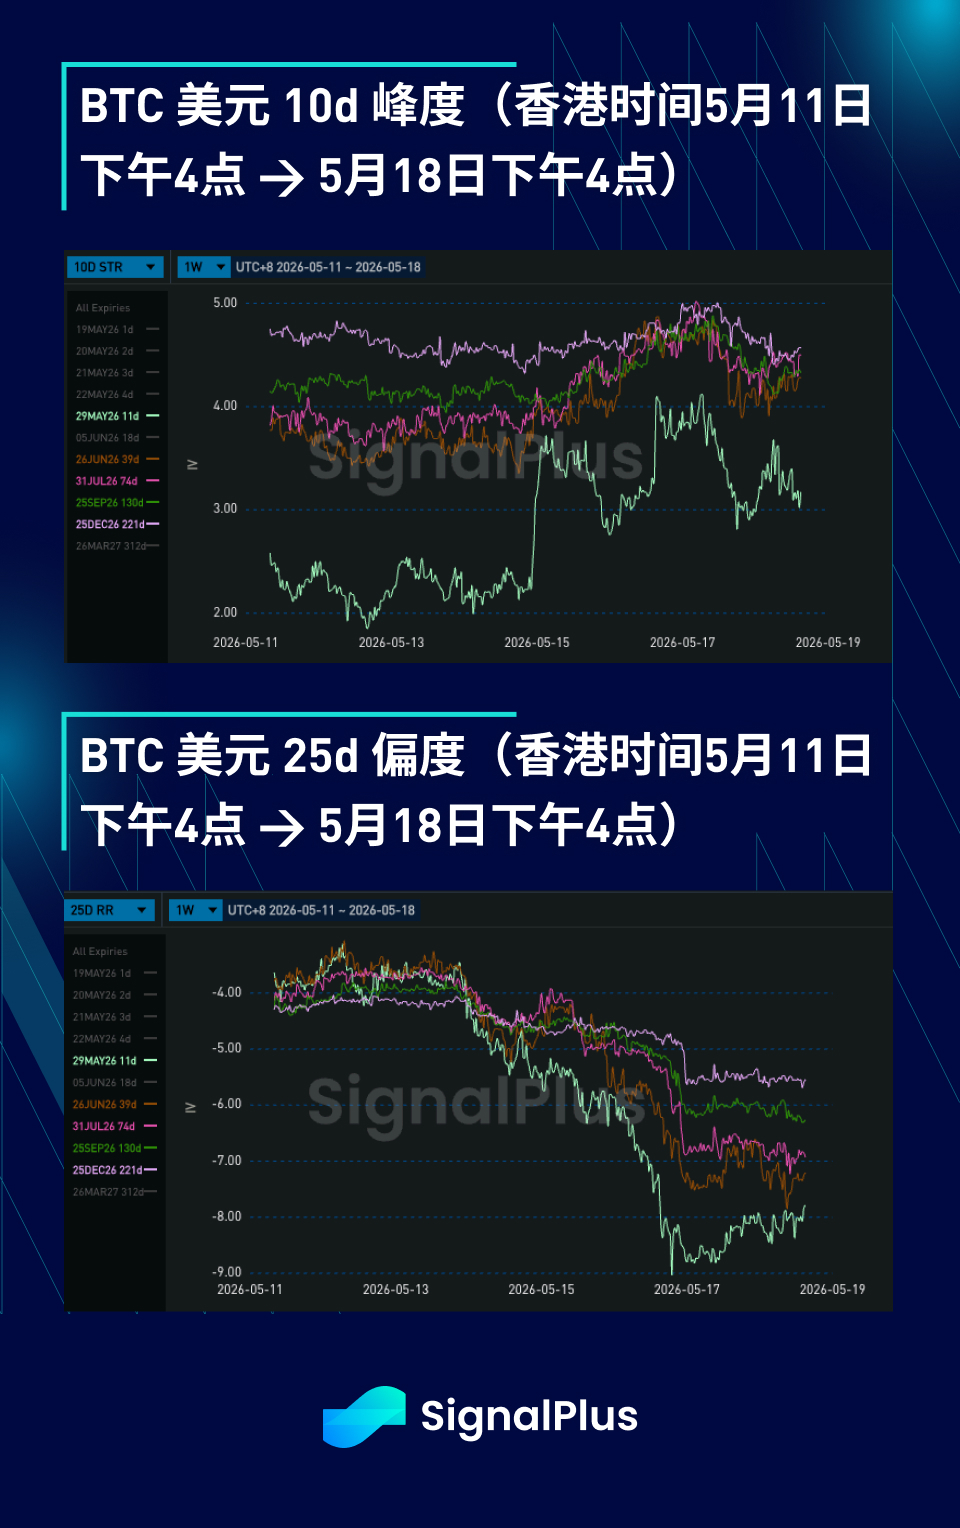
• Skew prices remain extremely sensitive to the spot direction. Since BTC first dropped to 79k last Wednesday, the Put skew has deepened rapidly. As the spot retraced over the weekend to create a new local low, the skew has further deepened downward, now close to the levels when BTC broke below 70k at the end of March/beginning of April, with strike prices below 60k.
Considering the current overall volatility benchmark has clearly dropped, this level of skew appears quite extreme. At the same time, the volatility above the coin price has been compressed to very low levels. This indeed reflects the current supply-demand structure (i.e., a significant amount of covered trades continuously selling Calls), but it may not reasonably reflect the potential changes in actual volatility and implied volatility if BTC rises again.
• The peak prices are continuing to rise overall, as the market remains cautious about shorting tail put options. At the same time, due to the steep skew, the upper Calls appear extremely cheap, so the market is trying to partially hedge this discount by raising peak pricing.
Considering that the current skew is already very extreme, and with leverage and positions in the spot market clearly reduced, we expect that it will become very difficult for the peak (especially the short end) to continue profiting in the downward direction in the future.
Conversely, if BTC can truly break through the resistance levels of 82-83k, there is considerable re-pricing potential for the skew (the downward skew will weaken), hence the upside peak still has good performance potential.
Wishing everyone successful trading this week!