Awesome, now that you’ve learned about RSI, it's time to dive into the Moving Average (MA), one of the pillars of technical analysis and super practical.
The moving average smooths out random price fluctuations to show you the true market trend (bullish, bearish, sideways). It's like a "compass" that guides you on the general path.
📏 What is the Moving Average (MA)?
Simply put, it's the average price of a specific asset over a set period (like 20 or 50 days). As a new period ends, a new price enters while the oldest price drops out, averaging and moving with the price.
The two main types for beginners:
1. Simple Moving Average (SMA): Gives equal weight to all prices in the period. A bit slower, better for long trends.
2. Exponential Moving Average (EMA): Gives more weight to recent prices. Faster to respond, better for short-term trading.
💡 How to use moving averages like a pro?
There are 3 main and direct uses:
1. Determine the overall trend (most important use)
This is the foundation. Look at the slope of the average line itself:
· Uptrend (line slope upwards): Trend is bullish → Think about buying only.
· Downtrend (line slope downwards): Trend is bearish → Think about shorting only.
· Horizontal/Flat: Market is sideways → Stay away from trading or use range strategies.
Golden Rule: Don't trade against the direction of the main moving average (like 50 or 200).
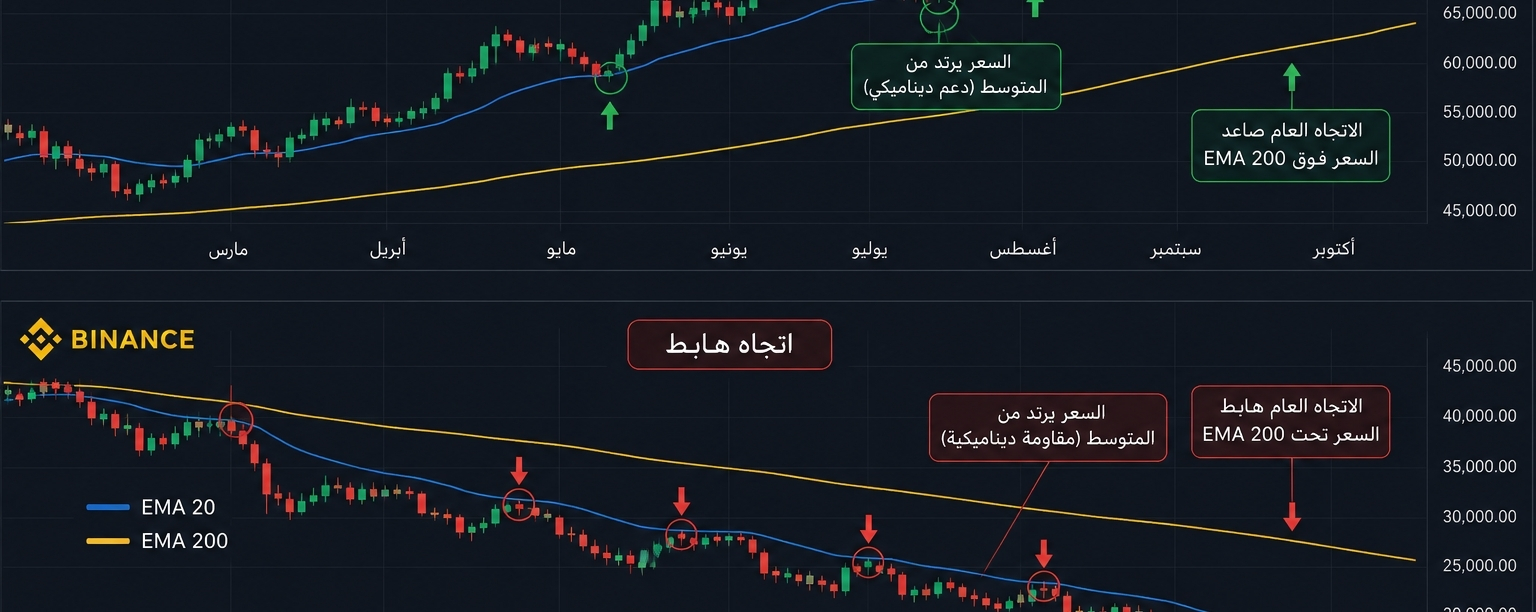
2. Moving Average as dynamic support and resistance
Instead of fixed support and resistance lines, the average moves with the price.
· In an uptrend, the price tends to bounce off the average upwards. Here could be a good buy point.
· In a downtrend, the price tends to bounce off the average downwards. Here could be a good sell point.
3. Golden Crosses and Death Crosses
This happens when using two averages: fast (like 20) and slow (like 50 or 200).
· Golden Cross: Fast average crosses slow average from bottom to top → Strong bullish signal (buy).
· Death Cross: Fast average crosses slow average from top to bottom → Strong bearish signal (sell).
📝 A practical example to apply now
On your demo platform (like TradingView):
1. Add two indicators: EMA 20 (fast) and EMA 200 (slow for overall trend).
2. Is the EMA 200 bullish or bearish? This determines your core strategy.
3. Is the price above the EMA 200? If so, think about buying only.
4. Did the EMA 20 cross above the EMA 200? This is a strong signal, but wait for additional confirmation (like candlesticks or RSI).
💎 The essence and a fundamental rule
· Averages aren't for predicting the future, but for keeping up with the present. They tell you where the price has been and what it's doing now.
· Don't rely on just one average. It's better to use a fast average (for entries and exits) and a slow one (for overall trend).
· In sideways markets, averages lose their strength completely and may give false signals.