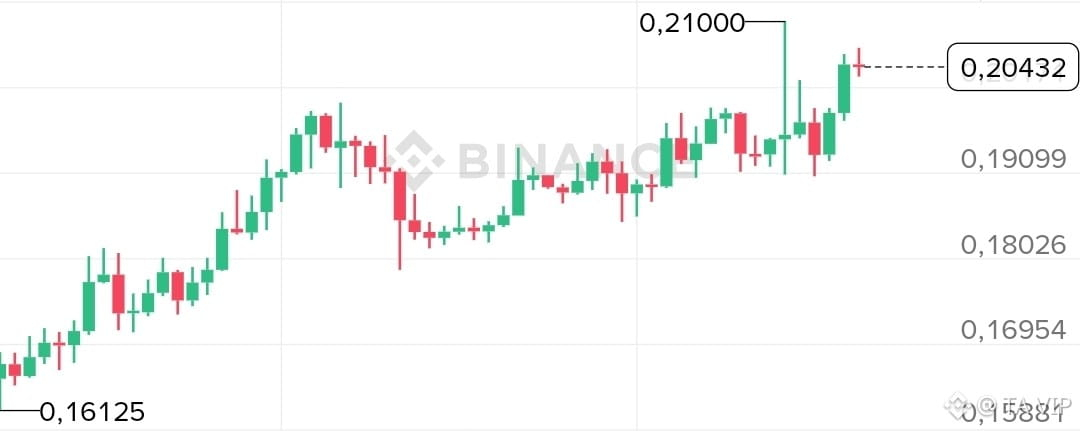
Looking at this 30-minute chart, there’s a solid basis for a strong pullback:
Reasons to watch for a pullback:
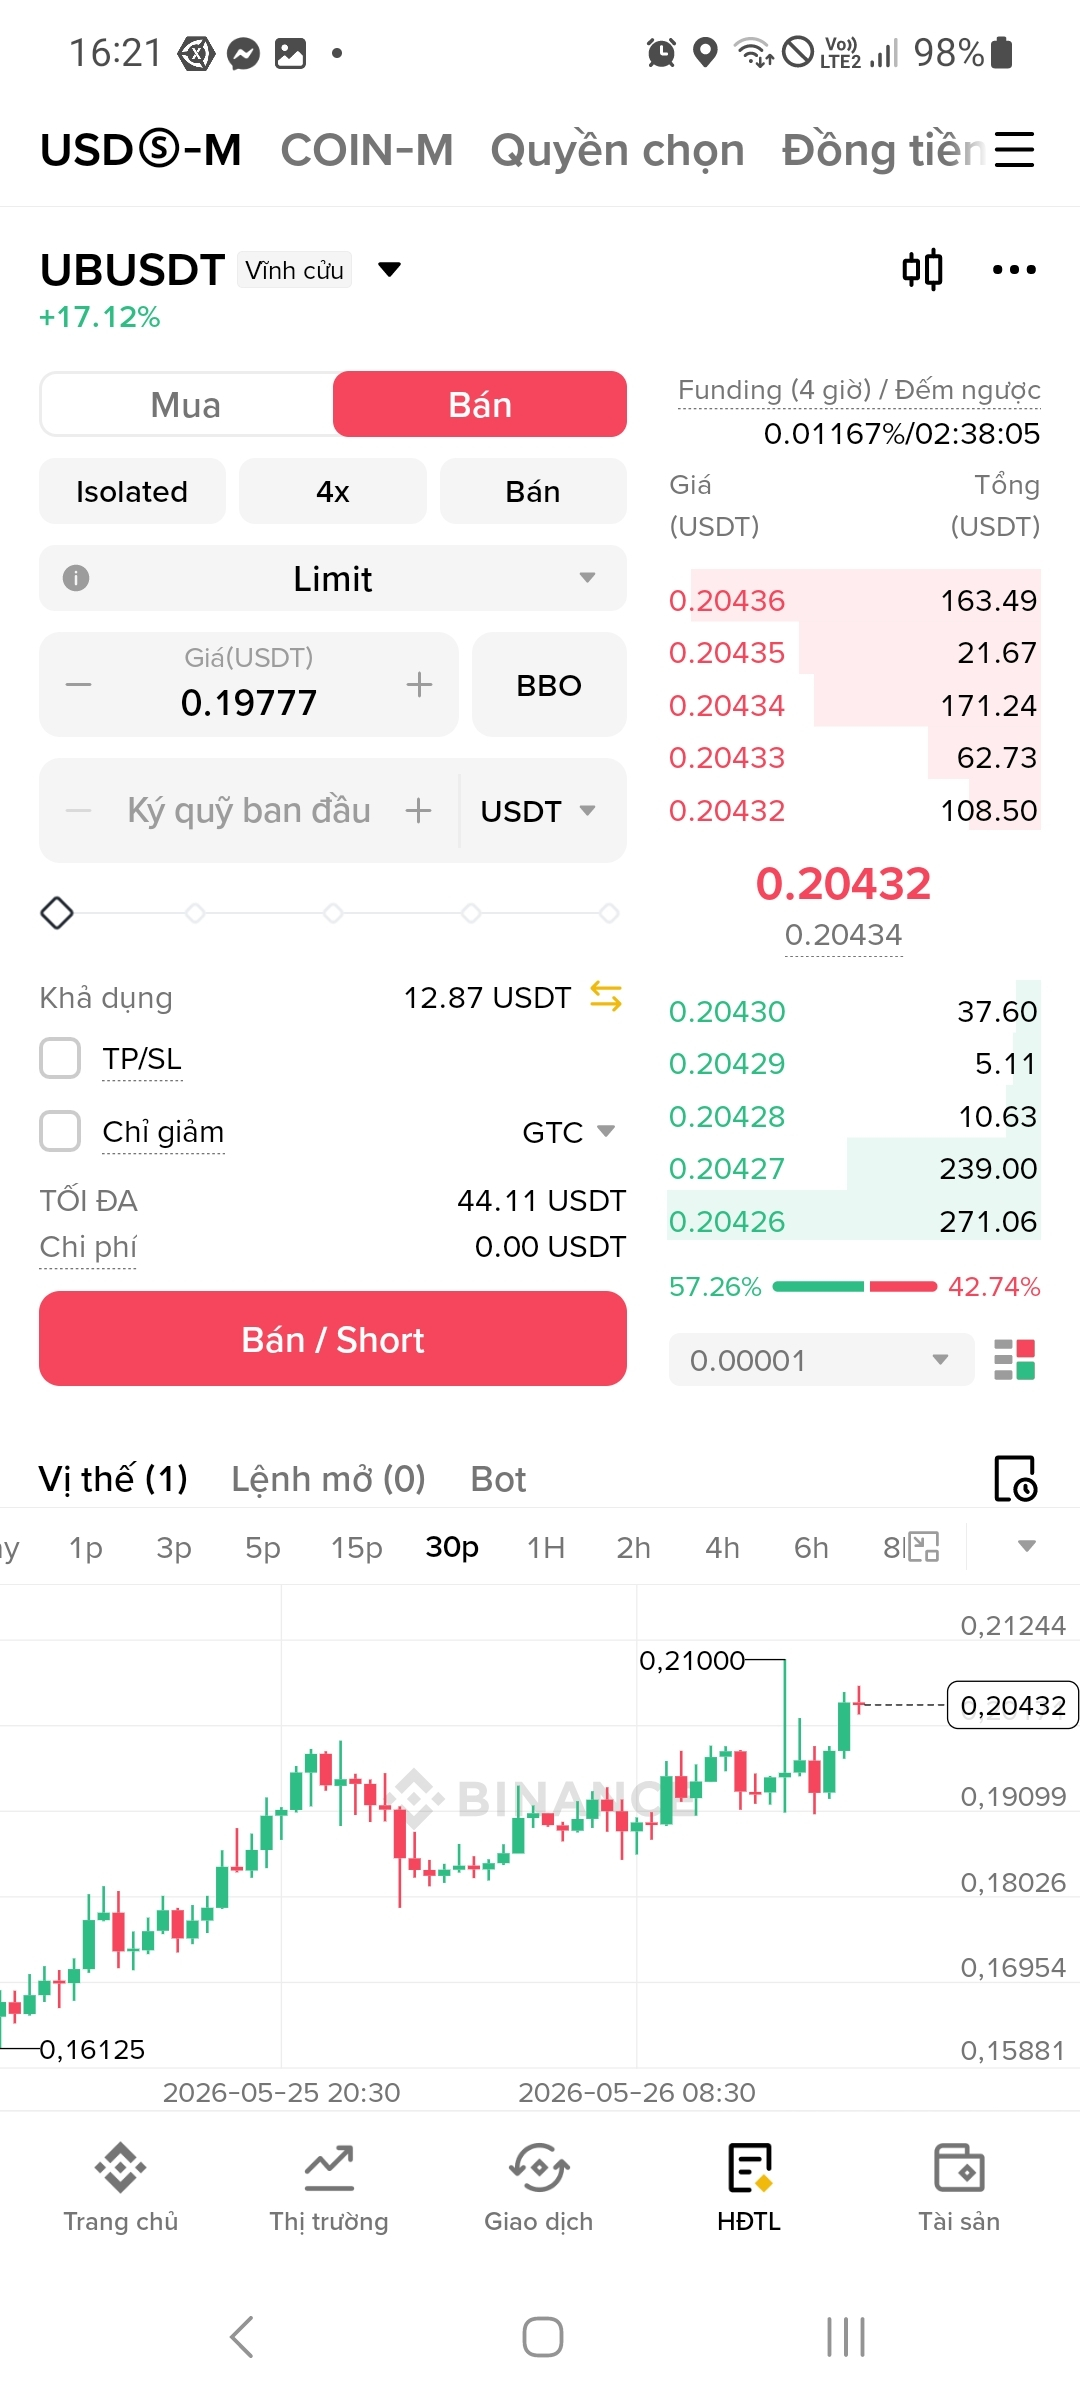
1. Hit resistance at 0.21 and got rejected: The candlestick touched 0.21 and then pulled back immediately, creating two small peaks around this level. This is a strong profit-taking signal.
2. The sell side on the order book is thicker: From 0.20432 to 0.20436, there are about 527 USDT in sell orders hanging. The buy side is much thinner. A simple sweep could break through 0.204.
3. Funding is up 0.01167%: The Long side is still crowded and paying high fees. The market is heating up + high positive funding often gets shaken out to balance things.
4. Long/Short reversal rate: The Long side was at 63.59% before the picture, now only 57.26%. The Short side has started entering.
The area to pay attention to if it dumps:
- Nearby support: 0.20426 - 0.20427; if it breaks through, it drops to 0.202.
- Strong support: 0.19 - 0.191, this is the swing low before the pump.
- If it breaks below 0.19: the chance of retesting 0.18 - 0.182 is very high.
But note: UBUSDT has extremely thin liquidity. 500 USDT is enough to push the price to run 3-5%. So technical signals on this one are easily faked.