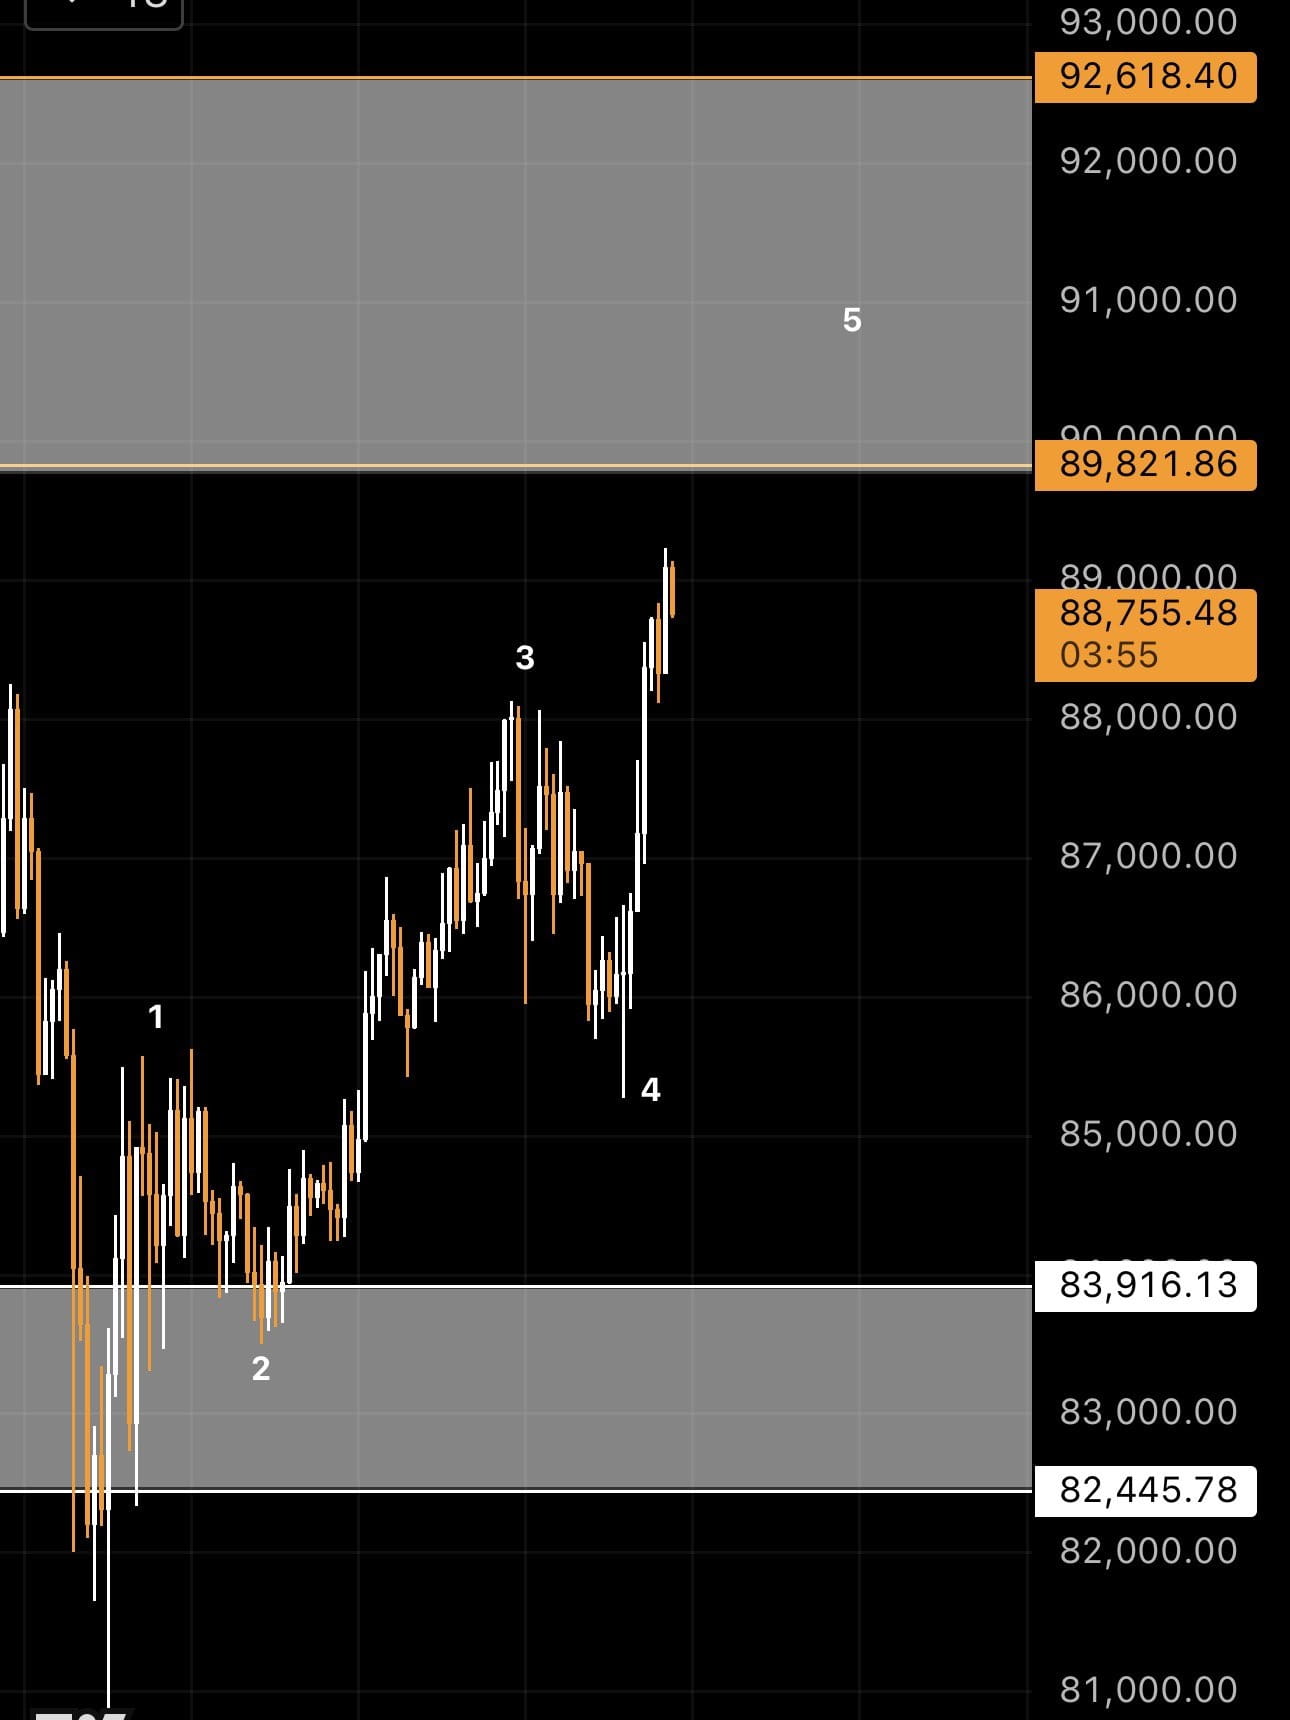
Bitcoin now 88 thousand
And this analysis on the hourly frame to follow the bounce and read the movement
Now we are in the first wave of the bounce followed by a correction and a retest to the range of 85/82 thousand,
To form the second wave and create divergence and then a launch, God willing
The chart and analysis on the hourly frame to follow the movement
And to determine the areas of the upcoming rebound and the end of wave 2.
The correction measurement of wave 2 is calculated using Fibonacci.
The tool is pulled from the beginning of wave 1, the bottom from which the rebound started.
To the end of wave 1, the peak that it will end at and targets wave 2 range to levels of 50% or 61.8% Fibonacci.
Wave 2 may extend to 78.6% Fibonacci.
In case it was a corrective wave of the Zigzag type.
But breaking the beginning of wave 1, the bottom at 80000, is prohibited, and even by one dollar, and without any closures breaking the bottom of 80000 will invalidate all this numbering.
- Now we are monitoring the formation of divergence on the hourly frame to confirm the end of the rebound by creating a peak higher than the peak on the chart and a lower peak than the peak on the RSI indicator, and usually the divergence is formed between waves 3 and 5 of the internal wave 1 that we are currently in.
This was an analysis on the hourly frame and on the daily and weekly frame the situation is positive and supports the rebound wave that I mentioned during the coming three months, God willing, and it is preferable to start paying attention to the market as we approach March 2026.
God willing.
In summary, any retreat during the coming week above the bottom formed at 80000 will be normal and there will be no issues, and this analysis will be an explanation for the correction and is normal.
And God knows best.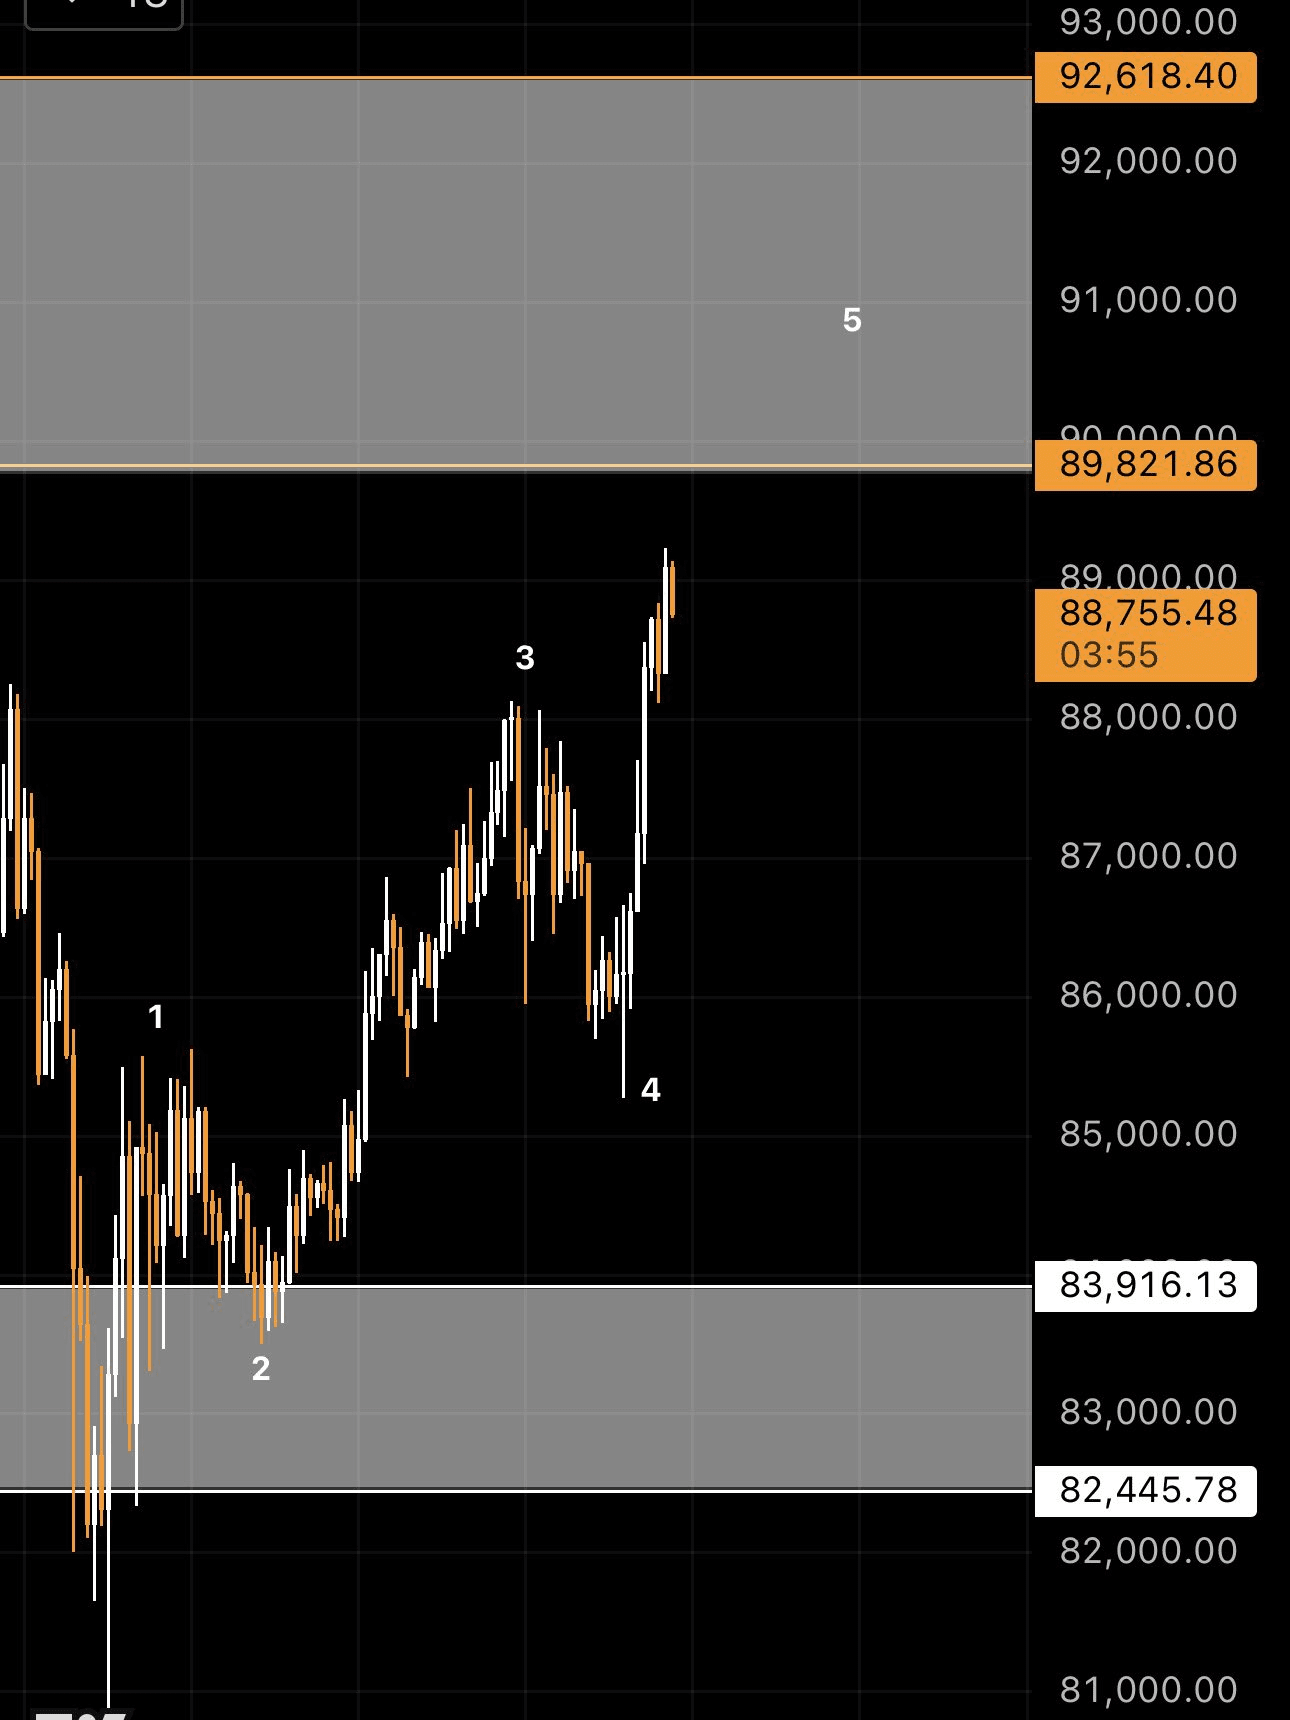 #FOMCWatch $BNB