IS IT A MIRAGE OR DANGEROUS DISTRIBUTION? THE $74K DILEMMA AND THE SECRET MAP OF ALTS
━━━━━━━━━━━━━━━━━━━━━━━━━━
👽✌🏻The crypto market is at a critical tipping point. As Bitcoin ($BTC) battles in the $74,246.60 zone, opinions within the financial ecosystem are sharply divided. On-chain data and technical analysis suggest we're facing a complex scenario: a full-blown fight between institutional distribution and the conviction of seasoned investors.
━━━━━━━━━━━━━━━━━━━━━━━━━━
📉 Bitcoin under the microscope: Structural cracks vs. Conviction
━━━━━━━━━━━━━━━━━━━━━━━━━━
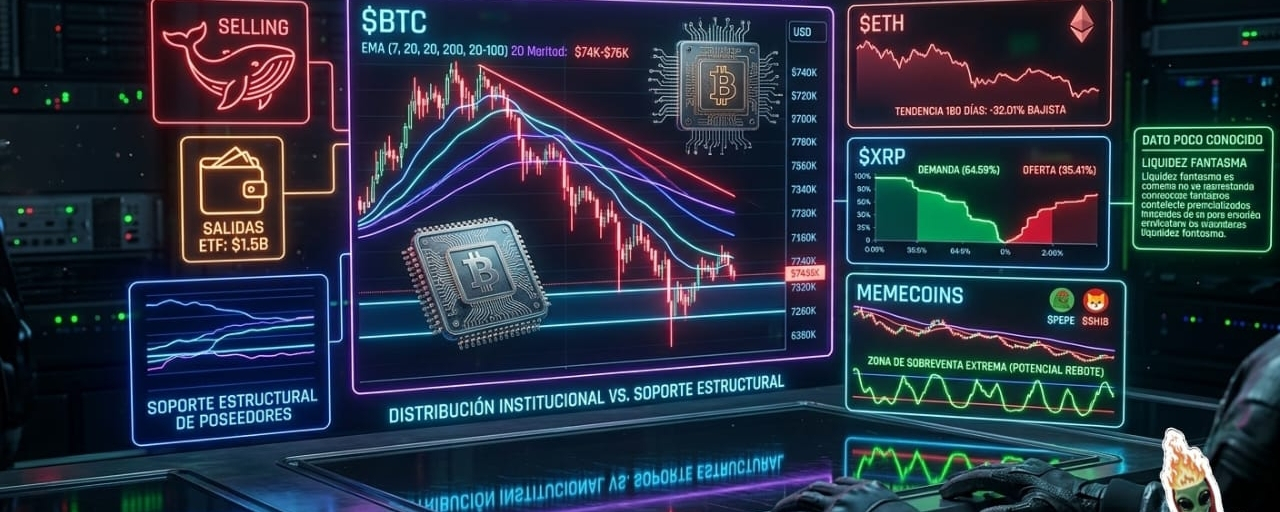
At first glance, BTC's behavior raises alerts reminiscent of past cycles. A recent report from CryptoQuant raises alarms by revealing that whale balances are decreasing at the fastest rate this year. Coupled with this, spot ETFs have just recorded massive outflows of $1.5B, posing an uncomfortable question in the market: with institutional marketing already established, who is left to absorb the supply above $70,000?
Technically, the reading demands impeccable risk management. BTC is currently trading below its EMA 20-100 cluster (near $76,000) and the EMA 200 (around $81,200) on a daily timeframe. This confirms that the immediate trend favors selling pressure. However, not all is bearish; unlike the liquidity collapse experienced in 2022, the supply in the hands of long-term holders continues to act as a structural buffer that keeps the floor firm.
━━━━━━━━━━━━━━━━━━━━━━━━━━
🏛️ The State of Altcoins: Ethereum and XRP at a Crossroads
━━━━━━━━━━━━━━━━━━━━━━━━━━
The analysis of major altcoins reflects a capital rotation and technical resistance landscape:
Ethereum ($ETH): Positioned at $2,040.83 with a slight daily uptick of +1.90%, the macro outlook continues to show weakness. ETH carries a negative performance of -32.01% over the last 180 days. The On-Balance Volume (OBV) indicator reflects a steady loss of buying pressure, sitting below its key moving averages.
XRP ($XRP): At a price of $1.3322 (+1.51%), it shows an interesting consolidation structure. Observing the real-time order book, strong support is detected: demand dominates at 64.59% against 35.41% supply. Despite trading below its EMAs of 7, 25, and 99 periods, retail buying interest in this zone is notable.
━━━━━━━━━━━━━━━━━━━━━━━━━━
🐸 The Memecoin Thermometer: PEPE and SHIB Oversold
━━━━━━━━━━━━━━━━━━━━━━━━━━
The meme sector often acts as the purest indicator of retail sentiment, and currently shows severe long-term wear, but with short-term windows of opportunity.
PEPE ($0.00000344): While it registers a +1.78% daily, it bears a painful drop of -76.60% over the last year. However, the StochRSI oscillator is at extreme oversold levels (7.70), which historically tends to precede prolonged technical relief bounces.
Shiba Inu ($SHIB): Trading at $0.00000546 (+2.06%). Its structure remains bearish, trapped below the dynamic resistance of the Supertrend (set at $0.00000602) and with moving averages acting as a heavy ceiling. Its StochRSI is also resting in the low zone (15.17), suggesting that the selling momentum might be temporarily running out.
━━━━━━━━━━━━━━━━━━━━━━━━━━
📊 Technical Dashboard Summary
━━━━━━━━━━━━━━━━━━━━━━━━━━
BTC/USDT: $74,246.60 | 180-Day Trend: -18.33% | StochRSI: 7.93 (Extreme Oversold)
ETH/USDT: $2,040.83 | 180-Day Trend: -32.01% | StochRSI: 20.40 (Oversold)
XRP/USDT: $1.3322 | 180-Day Trend: -1.68% | StochRSI: 18.47 (Low)
PEPE/USDT: $0.00000344 | 180-Day Trend: -25.22% | StochRSI: 7.70 (Extreme Oversold)
SHIB/USDT: $0.00000546 | 180-Day Trend: -18.23% | StochRSI: 15.17 (Low)
━━━━━━━━━━━━━━━━━━━━━━━━━━
💡 Little Known Fact: The 'Phantom Liquidity' Paradox
━━━━━━━━━━━━━━━━━━━━━━━━━━
A little-discussed phenomenon among retail traders is the divergence between ETF outflows and the increase in Illiquid Supply. When ETFs show massive sell-offs but the price does not collapse vertically, a scenario is created where coins are migrating directly into native cold custody wallets (off the institutional circuit). This means that, although the market appears 'dry' of buyers on daily order charts, the structural floor becomes mathematically stiffer, reducing the actual floating supply available for the next bullish impulse.