Introduction: When information overload becomes the new challenge
In the digital asset space, the biggest headache for pros often isn't a lack of info, but rather the info being too scattered. Over the past week, we've noticed our team members having to switch between multiple data platforms, news sites, and social media over ten times while doing project research. This constant toggling not only disrupts their flow but also makes it easy to miss crucial info.
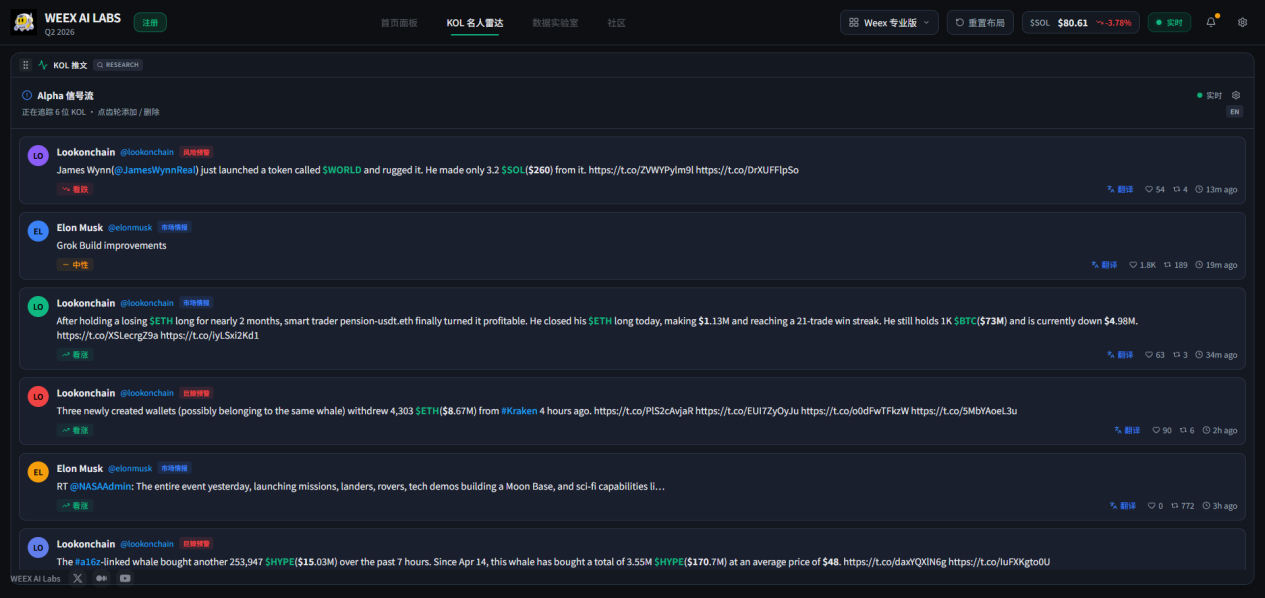
WEEX Labs aims to tackle this pain point by launching the 'Crypto Data Dashboard', designed to consolidate scattered data into a unified interface, providing users with a more efficient information browsing and analysis experience.
Tool Logic: A one-stop design where search is synchronized.
The core of this dashboard lies in "interconnected integration". When a user enters a project name, the system will simultaneously display information such as its price trend, relevant public policy updates, community sentiment references, and on-chain data overview.
We adopted a "subtraction" approach, avoiding complex algorithms and instead using technology to reduce the time cost for users switching between different platforms, making the information retrieval and analysis process more seamless. Internal testing data shows that this design significantly improves information processing efficiency.
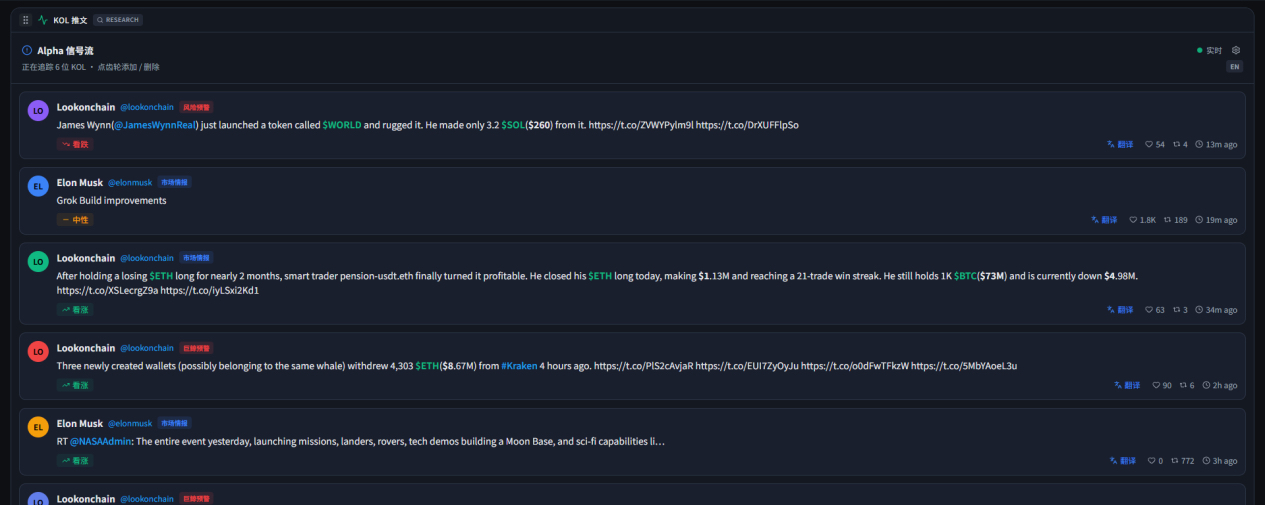
Experimental features: Community voice and on-chain dynamic monitoring
In the "Community Observation" module, we have introduced an AI semantic analysis function that can label the sentiment of public discussion content, helping users quickly distinguish the tone of different viewpoints.
It should be noted that AI analysis is only an auxiliary reference tool, and human judgment is still necessary, especially in the face of emergencies. Currently, this function is mainly used to help users filter out a large amount of noisy information and focus on more valuable content.
Kanban's positioning: A supplementary information tool, not a panacea.
WEEX Labs positions this dashboard as a data aggregation and visualization tool. Its data comes from public data platforms such as CoinMarketCap and CoinGecko, as well as publicly available information from prediction markets such as Polymarket, aiming to provide users with objective data references.
In the future, we will continue to optimize data coverage and response speed, and improve various functions based on user feedback.
Data Lab: From Empirical Perception to Quantitative Observation
The "Data Lab" module in the dashboard provides several quantitative metrics, such as the "Altcoin Season Index" (the performance ratio of the top 100 projects relative to Bitcoin) and predictive market data. These metrics can help users more intuitively understand the overall structural characteristics of the current market.
In complex market environments, combining multi-dimensional data for rational analysis is gradually becoming an important method for professionals.
Explanation of the "Trend Reference" module
The trend analysis module in the dashboard is a feature that has received a lot of user feedback. This module is based on historical technical indicators and trading volume data to build a model, providing only a trend probability reference rather than a precise price prediction.
We have repeatedly emphasized that no model can accurately predict short-term price movements. The core value of this module lies in helping users assess the consistency of market trends, rather than providing trading instructions.
Subsequent iteration directions
WEEX's encrypted data dashboard is still in a continuous iteration phase. In the short term, the focus is on improving data timeliness and stability, while in the medium term, more customizable analysis dimensions will be added based on user feedback.
We sincerely invite every user to provide valuable feedback through the platform's feedback channels to jointly promote the optimization of the tool.