

Key Indicators: (May 18, 4 PM HKT -> June 1, 4 PM HKT):
BTC/USD down 5.5% ($77,000 -> $72,750), ETH/USD down 6.6% ($2,120 -> $1,980)
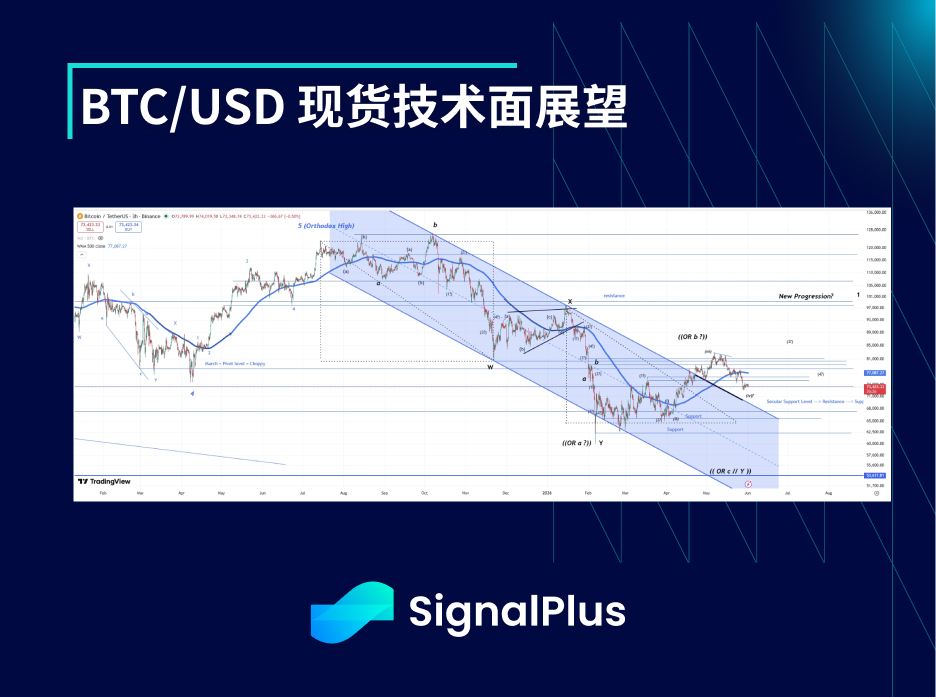
BTC/USD Spot Technical Outlook:
In the past few weeks, the price action has shown some weakness, pulling back and breaking below certain local support levels. However, the actual volatility remains low, still aligning with a more stable, and ultimately often more constructive path.
At the current levels, if we break below $71,000, it will open up space below $68,000 (already happened), with the next downside target being $60,000. But given that current positions are notably lighter than before, the probability of this scenario looks low. On the upside, a breakthrough above $82,000 will open up further upward space; however, the current pattern/structure indicates that a significant bullish rally is expected to materialize by late summer or Q4. We maintain a constructive long-term outlook, but anticipate that price action will likely remain subdued in the coming weeks unless geopolitical tensions escalate further.
Market Theme
Despite the fact that no formal agreement has been announced between the U.S. and Iran over the past few weeks, the news headlines have been leaning positive. The latest reports say that both countries have agreed to extend the ceasefire for another 60 days, "but it still needs Trump's signature approval." Meanwhile, China has been consuming its strategic oil reserves instead of buying in at high prices, which has somewhat suppressed global oil demand. This, combined with a steady flow of improving positive news, has caused oil prices to retreat by 20% from their highs. At the same time, investors seem to be under-allocated in equities fundamentally, and with mixed news flow, the stock market is quickly bouncing back from its lows. So, even though the final agreement is not yet confirmed, the S&P 500 and NASDAQ indices continue to hit new highs. It’s reasonable to infer that once the final agreement is confirmed, the market should continue to see upward movement as the "uncertainty premium" gradually diminishes.
In the meantime, over the past two weeks, major crypto assets (BTC, ETH) have seen persistent outflows from their ETFs, likely driven by opportunity cost rotation: funds flowing from these ETFs into stocks and also into HYPE (which has attracted a lot of attention in the crypto space, understandable). Gold has also seen a noticeable pullback from recent highs, as there seems to be some pressure above, and investors are reallocating funds towards imminent IPOs and stock-related trades. Our baseline scenario remains that Bitcoin and gold will see significant upward movement later this year; however, during the summer, we should expect them to primarily consolidate (likely not participating much in the stock market's upswing). BTC$ ATM implied volatility:
BTC$ ATM implied volatility (May 18, 4 PM HKT -> June 1, 4 PM HKT)
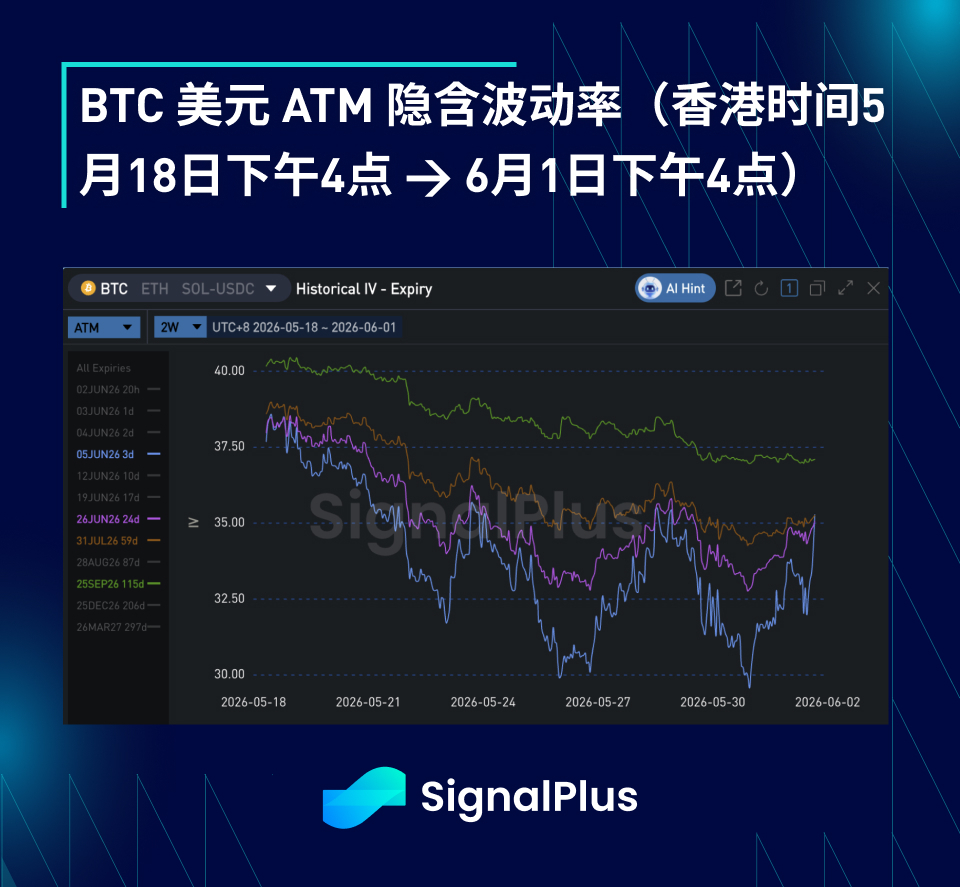
Despite the spot price retreating from above $80,000 to a low of $72,500 over the past two weeks, the actual volatility has remained quite low for most of the time. The only exceptions are mainly due to thin weekend liquidity causing fluctuations and the recurring market movements triggered by U.S.-Iran news. The actual volatility has consistently stayed well below 35-36 vol, with some trading days only hitting 20-25 vol. This has pushed the front-end daily implied volatility down into the 30-35 vol range; meanwhile, the term premium further out on the curve continues to be squeezed out, especially as we enter the summer months. Overall, the implied volatility has been trending down over the past two weeks.
The term structure of the volatility curve has actually flattened at the front end. Given the current implied volatility levels, the breakeven point is relatively low, and with the coin price action looking "more interesting" around $73,000, there has been some buying demand on both sides of the spot market. The term structure further out on the curve appears steeper, but visually it can be misleading due to seasonal factors and the market's demand for volatility related to the mid-term elections in Q4, suggesting natural support for expiration dates in December 2026 and March 2027.
BTC$ Skew/Kurtosis:
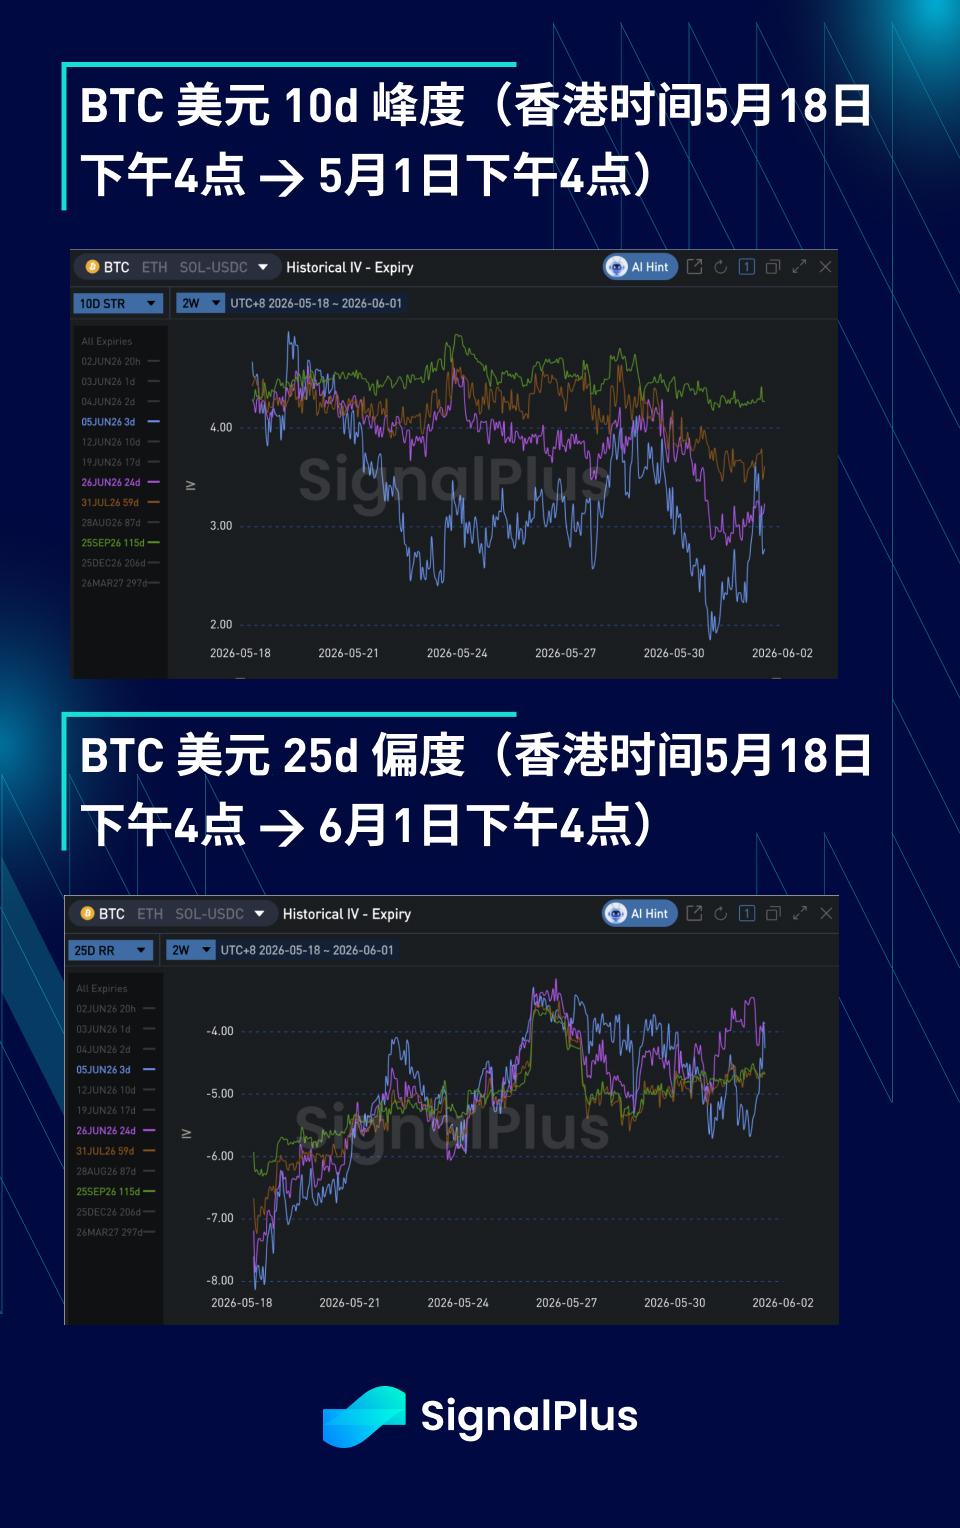
The sensitivity of skew to spot direction has decreased. As the spot moves down in an orderly fashion, the skew has even started to rise from a deep bearish level a few weeks ago. At the current price level, there hasn't been significant demand for deeper out-of-the-money puts (below $65,000), indicating lighter spot positioning or lower demand for hedging. On the other side of the skew, the market continues to see substantial supply of bullish-side volatility from covered/hedging sellers. For example, last Friday, about 5,000 BTC nominal of July $80,000 call options were sold. Therefore, with these ongoing fund flows expected, the bullish-side volatility remains suppressed.
The kurtosis of prices is generally sideways or trending down, which matches the price action of oscillating within a range and limited demand for options outside that range. A few localized directional trades are exceptions; however, even so, due to the overall compression of the price range, we see many of these trades implemented through call spreads and put spreads. Wishing you a successful trading week ahead!
