Solana ($SOL ) is trading in a range of \(\$70\) to \(\$85\), going through a corrective phase with strong selling pressure. The asset is approximately \(74\%\) below its all-time high, dealing with the loss of key short-term moving supports and a significant rejection in the \(\$90\) zone. Key Metrics Current Price: Ranges around \(\$72 - \$85\), depending on the exchange (you can check the live quote on CoinMarketCap or eToro). Market Capitalization: Stands between \(\$42 billion\) and \(\$48 billion\). Distance from its all-time high: \(-74.43\%\). Technical Analysis: Short-term oscillators (like the RSI) suggest oversold levels, but the rejection of the advance above \(\$90\) keeps bearish alerts alive. Market Outlook Recent Weakness: Unlike other assets in the sector, Solana has suffered severe drops (around \(10\%\) on certain recent days), losing critical supports. Fundamental Factors: Analysts point out that much of the volume and use cases on the Solana blockchain have been driven by memecoin trading, which increases its volatility. Medium-term View: In light of the decline, some experts see SOL more as a long-term hold asset than an immediate safe buy, with mixed 5-year forecasts suggesting a gradual recovery. If you want to make a decision based on this data, let me know, and I can help you: Analyze the SOL/USD pair using the TradingView interactive chart. Review metrics and orders through platforms like Kraken.
Article
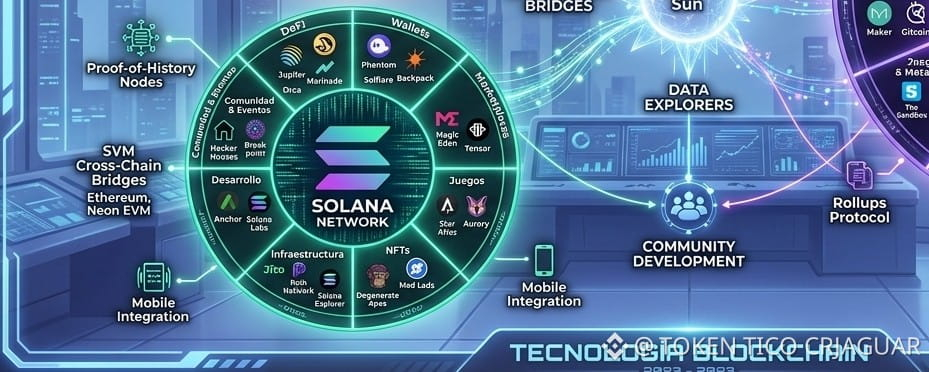
Solana 👉🏻❤️🩹👈🏻