The integrated analytical dashboard I've prepared for you provides a comprehensive overview of ALLO/USDT performance. As you can see, the key data is summarized in clear and straightforward analytical boxes on the candlestick chart, giving you deeper insight beyond just the exchange rate.
Key Analysis Points:
 $ALLO
$ALLO #كاس the world
#نجوم the Atlantic
ALL$ $USDC
Consolidation Phase and Base Building: It's clear from the 'Range Accumulation' zone that the price is moving sideways, indicating liquidity accumulation and price consolidation after a strong move.
Support and resistance levels: The nearby support level is set at 0.1802 and the immediate resistance level at 0.1843. Breaking either of these could define the next trend.
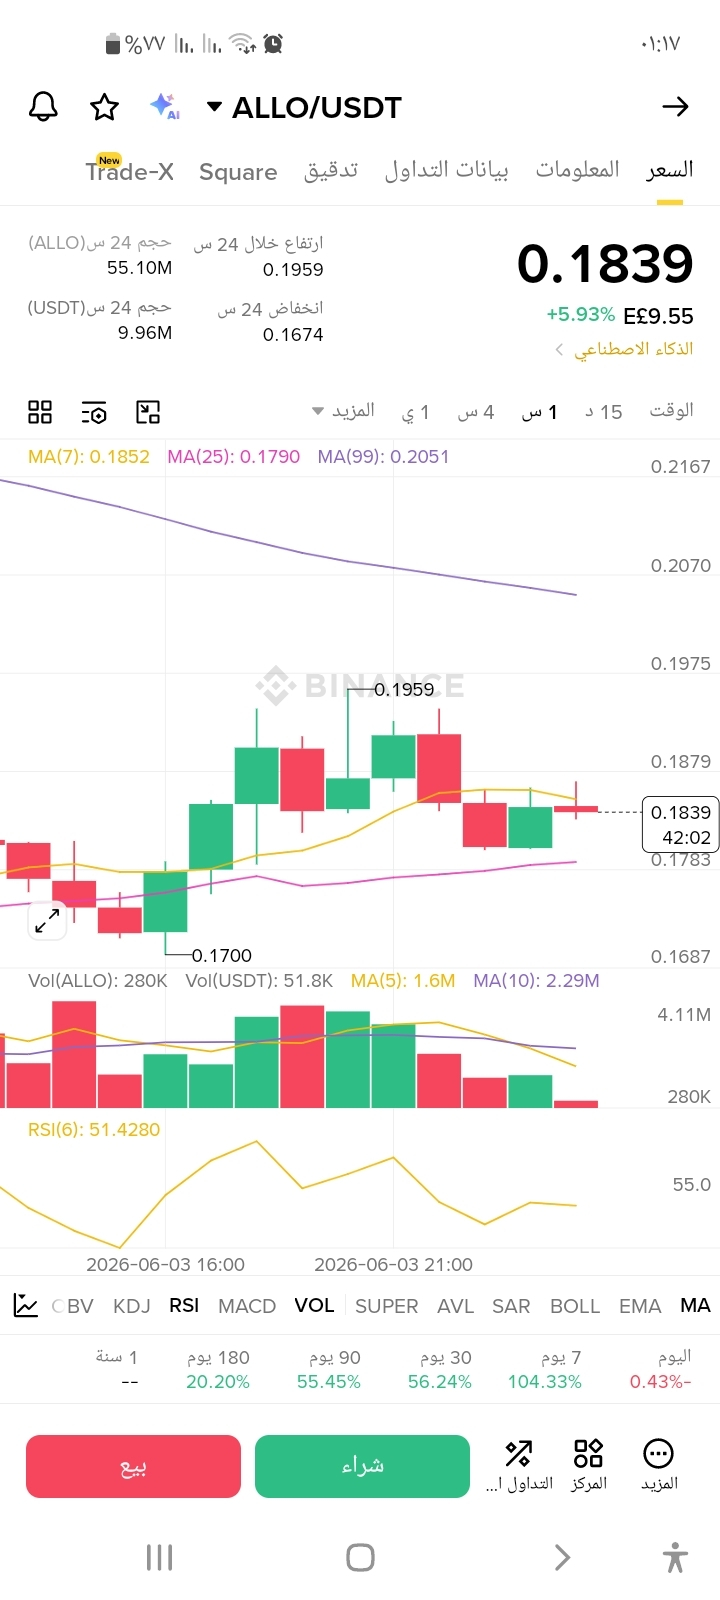
Targets and previous highs: The level of 0.1959 is considered the previous high and the 'main target', as data suggests the overall trend is looking for bullish continuation towards this level.
Technical indicators: The RSI is at a neutral level (46.8), indicating no overbought or oversold conditions, and trading volume is low and stable.
Long-term gains: The board notes that the coin has recorded strong long-term gains, increasing by over 104% in the past 7 days, which supports the positive outlook.
This integrated analysis gathers all relevant data in one interface to make decision-making easier.