Technical analysis:
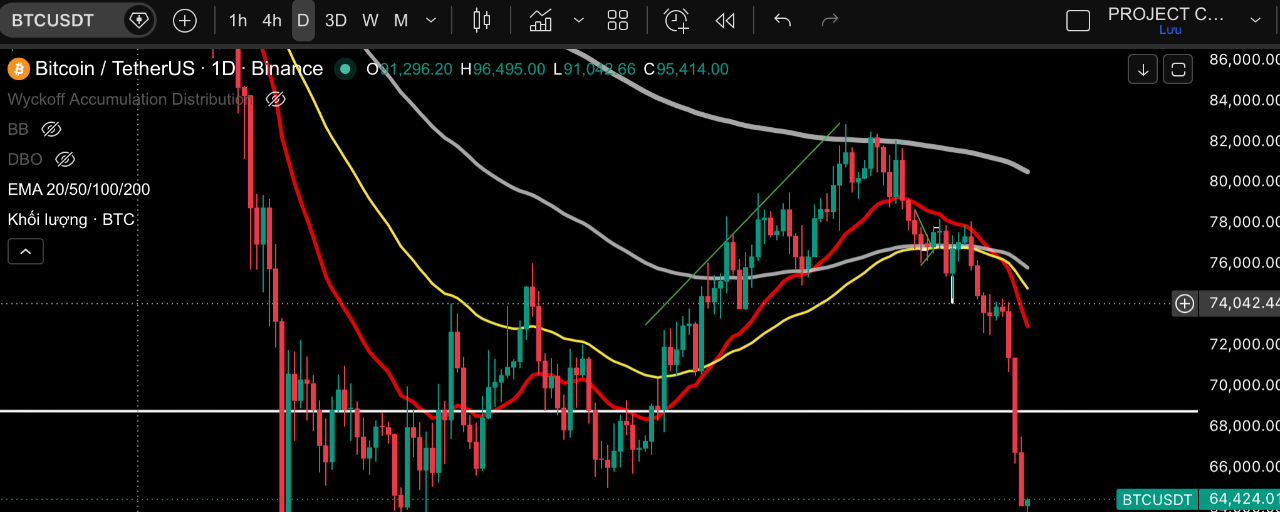
1D Chart: The major trend is still on a strong downtrend, complete breakdown, long red candlestick, strong, price is still below all key EMAs, no signs of accumulation yet. However, the most recent candle is a green one with a long wick indicating that buyers are aggressively stepping in to catch the bottom here.
4H Chart: The overall trend remains bearish, RSI is oversold and momentum still shows that selling pressure is dominant, however, the latest 4H candle indicates that buyers are making a strong comeback with a long wick green candle. Therefore, we might expect a short-term bounce.
1H Frame: The overall trend is still bearish, but the RSI has bounced back through the signal from the oversold zone. Momentum indicates that the last two candlesticks in the 1H frame show buyers returning to support the price more strongly. In summary, according to technical analysis, the larger trend remains bearish, but the short-term frame indicates that buying pressure has returned, making it a good time to catch the dip.
Regarding the flow of funds:
Stablecoin: The 4H and 1H frames of stablecoins are starting to correct. The 4H frame shows a long-tailed red candlestick with a short body, while the 1H frame has two long-bodied red candles. It's expected that stablecoins will continue to decline in the short term. We anticipate a bounce for the entire market.
The market cap percentage of BTC has started to recover technically after the recent sharp drop, with the RSI and momentum supporting further recovery trends in the 1H and 4H frames.
The total market cap is in a recovery phase in the 1H and 4H frames. We expect another bounce. In summary, the flow of funds indicates that the technical recovery will continue.
Leverage data and crowd sentiment:
All day yesterday, the LONG positions got liquidated heavily; the liquidation amount was significant, resulting in a prevailing fear in the market. Attempting to catch the LONG dip now is not the same as it was yesterday or in previous days.
The inflow of funds is primarily spot money, which is more sustainable.
The heatmap above shows 66K.
The crowd is beginning to shift their psychological state; the previously bullish LONG sentiment is now turning fearful, with some jumping into shorts, hoping for a panic sell in the market.
-> This is good data for us to expect a bounce in the 1H and 4H frames.
To summarize the data, I have one scenario: LONG