🚀 Binance has officially launched stock trading! How should crypto traders pick US stocks and analyze data? This piece explains it all.
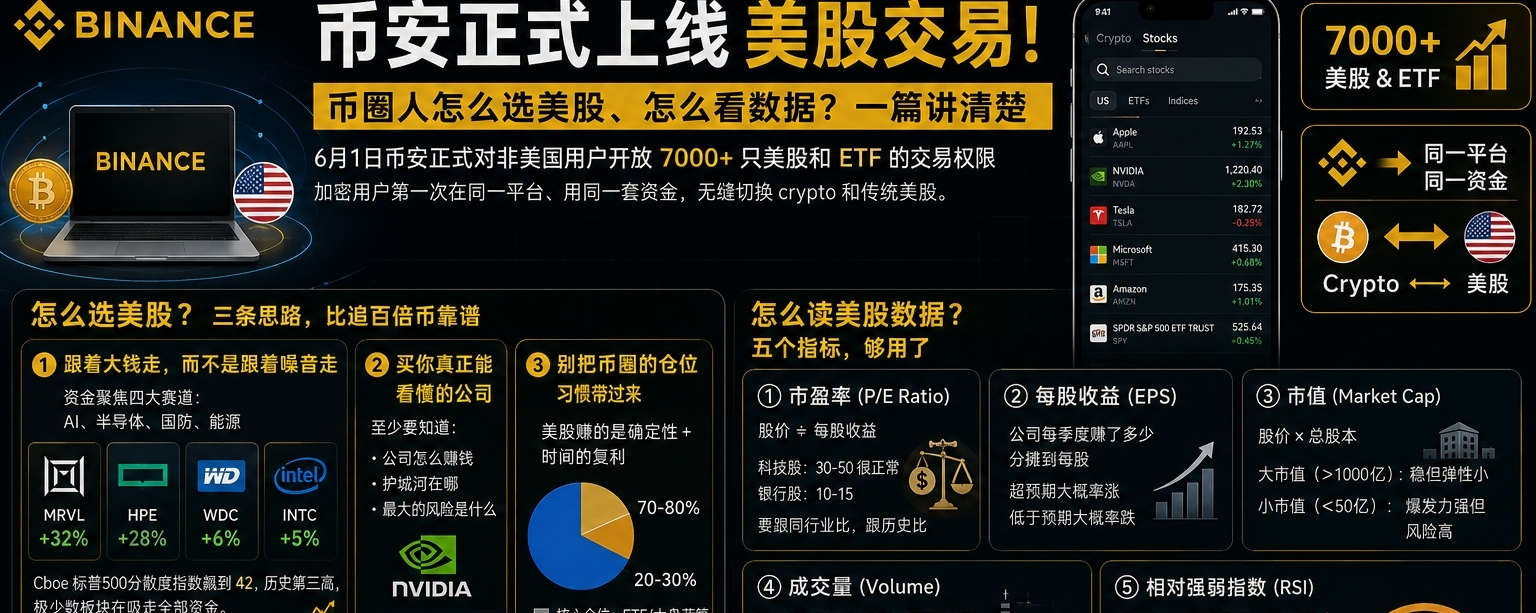
Hey fam, on June 1st, Binance officially opened up trading for over 7000 US stocks and ETFs for non-US users. Seriously, this is way bigger than most people realize—crypto users can now seamlessly switch between crypto and traditional US stocks on the same platform, using the same funds. 🎯
But now the question is: crypto folks are used to reading candlesticks, chasing narratives, and going all in on meme coins, but the US stock market has a totally different playbook. This post is here to help you clarify 'how to pick' and 'how to read' those two things.
📌 How to select US stocks? Three strategies that are more reliable than chasing 100x coins.
First rule: Follow the big money, not the noise.
The biggest difference between US stocks and crypto is—there's no 'consensus pump' here, only performance-driven moves. Where is the money flowing right now? Open any financial terminal, and you’ll see: AI, semiconductors, chips. Marvell (MRVL) skyrocketed 32% in a day because Jensen Huang named it 'the next trillion-dollar company' at Computex. HPE jumped 28% in a day due to exploding AI infrastructure demand. Western Digital rose 6%, Intel 5%—all on the AI front.
Data from Binance Research is eye-popping: Cboe S&P 500 dispersion index soared to 42, the third highest in history. This means—not the whole market is rising, but a few sectors are soaking up all the funds. AI, semiconductors, defense, energy—these four sectors capture the vast majority of capital inflow. So, the first lesson isn’t 'which stock to pick,' but rather 'which sector to choose.' If you pick the wrong sector, no matter how good the company is, it won't outperform.
Second rule: Buy companies you truly understand.
One bad habit in crypto is buying a coin without even reading the white paper. If you did that in the stock market, it would be a disaster. You don’t need to understand it to the point of writing a research report, but at least know how the company makes money, where its competitive moat is, and what its biggest risks are. For example, NVIDIA's profits come not just from the chips themselves, but from the CUDA ecosystem locking developers into its platform. That moat is tougher than any technical specs. If you understand it, you can hold onto it.
Third rule: Don’t bring your crypto position habits over here.
In the crypto world, you can chase a low-cap coin with a 10% position and potentially see a 100x return. You won’t see that in the stock market. In stocks, it’s all about certainty compounded over time. So, the position management logic is totally different—core positions should be in ETFs or blue-chip stocks, while small positions are for speculating on stock catalysts. Don't go all-in right off the bat; that's not trading, it's gambling.
🔍 How to read US stock data? Five indicators will suffice.
Many people get overwhelmed by the dense data on stock market pages. In reality, just focus on these five indicators, and you’ll be fine:
① Price-to-Earnings Ratio (P/E Ratio): Stock Price ÷ Earnings Per Share. This is the most straightforward indicator of 'is it expensive?' Tech stocks usually have a high P/E (30-50 is normal), while bank stocks are lower (10-15). Don’t just look at the absolute value; compare it with peers and its own historical values. ② Earnings Per Share (EPS): How much the company earns per share every quarter. During earnings season, the key is to see if EPS beats or misses expectations. If it beats, it’s likely to rise; if it misses, it’s likely to drop—this is more effective than any technical indicator.
③ Market Cap: Stock Price × Total Shares Outstanding. Large caps (>$100 billion) are stable but less volatile, while small caps (<$5 billion) have strong upside but higher risk of failure. Newbies in crypto should start with large caps to get familiar before diving deeper.
④ Volume: Rising without liquidity is just a game. If a stock rises 5% but volume is half of usual, it’s likely a false breakout—don’t chase it.
⑤ Relative Strength Index (RSI): ranges from 0 to 100; above 70 is overbought, below 30 is oversold. This is a reference indicator for 'don't chase at the top,' not a buy/sell signal itself—but it can help curb your FOMO.
💡 Let's wrap up with some real talk.
Binance launching US stock trading marks a turning point: crypto users are truly entering traditional capital markets. This means the era of 'only playing coins' is slowly ending. But we need to be clear—US stocks aren’t crypto; there’s no 100x myth, nor is one needed. Its appeal lies in accumulating certain returns gradually through time and knowledge.
And don’t treat US stocks as a safe haven from crypto volatility. When it’s time to drop, both sides will fall together—on June 3rd, the Dow dropped 500 points, and Bitcoin was down too; no one gets to laugh at anyone.
#币安 #bStocks #美股 #美股入门 #美股选股 $BTC

