Technical Analysis:
1D Chart: The primary trend is still bearish, with a candlestick wick at the bottom of the 61K7 zone. Currently, the bearish trend isn't as strong as it was in previous days and shows signs of potentially reversing. It's like a train slowing down as it approaches the station; the market is in a similar state called bearish momentum. So, the question is whether it will drop at this final station or pause here before continuing the previous trend. The station is the price zone of 61K7. If the price breaks through that zone with a strong candlestick body and high volume, we can understand that the bearish trend will continue. However, right now, with the price still at 62K6 and the candle movements like this, we can hope that this is the final station and there’s a chance for a bullish reversal. But the candlestick signals haven't indicated accumulation or a reversal yet; they only suggest that the bearish momentum is losing strength and speed.
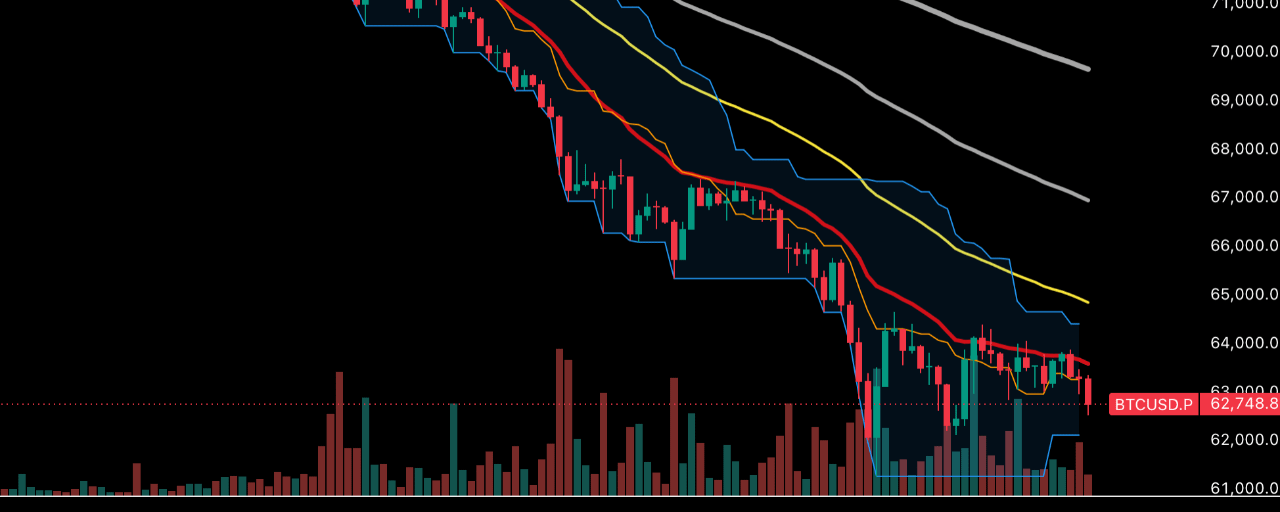
4H timeframe: The price is still in a bearish trend, but a few recent candles are showing sideways action, with higher lows forming. RSI has been consistently in oversold territory, and there are no signs of crossing the signal line upwards yet. At this point, trying to catch the bottom still carries a high risk. The most recent 4H candle has a strong long body, which means it's still not safe to enter LONG.
1H timeframe: The overall trend is still bearish, and the price is still below the EMA lines. RSI is neutral but has crossed the signal line downward. The candles are still forming higher lows, creating an upward trendline. In summary, technical analysis shows that the selling pressure has eased, but there are no signals for a bullish move yet. Right now, entering a LONG position means we are trying to catch the bottom. The risk-to-reward ratio is 40/60 for the LONG position.
Regarding the flow of funds:
Currently, the 1D timeframe for stablecoins shows a peak at 8.847%. Zooming into the 4H timeframe reveals that USDT is in a state of bearish RSI divergence, suggesting a high likelihood of a decrease at $USDT . We expect BTC and altcoins to recover soon, possibly not far off.
BTC.D on the larger scale remains in a waiting state for a drop. If it breaks strongly below 56.8%, we can expect a significant rally for the entire market soon.
Market capitalization is still on a downtrend, but the RSI for market cap is in oversold territory on a larger scale, indicating a high chance of a rebound. Currently at 2.14T, if it drops further, the maximum is down to 2.06T, where we would see a rebound. In summary, the flow of funds indicates that BTC and altcoins are about to have a recovery rally.
Data on leverage and crowd sentiment:
Liquidation levels yesterday dropped 50% compared to previous days, which makes sense as retail traders didn't use leverage much, neither catching LONGs nor SHORTs, swinging back and forth without any significant action, and positions compared to previous days are much smaller, so MM didn't have enough liquidity to sweep heavily.
Since last night, the crowd has been building more LONG positions, accumulating more LONGs, but there is still little capital for MM to push prices down aggressively to wipe out LONGs. In summary, leverage data shows no hot signals yet; today, the price may continue to sideway downward. The potential drop could be to 59K9 - 62K1 before it rises. If we reach that point without any hot signals, the price is likely to move that way.
In conclusion, I have two scenarios:
Scenario 1: The price is likely to sideway down from the current level to around 62K1 before it rises.
Scenario 2: The price may rise from the current level of 62K5 and above. Therefore, entering a LONG position now could be safe as it won't get slammed or swept.