
🔥The market is going through a strong shakeout. Bitcoin (BTC) briefly dropped below the $60,000 mark after the stronger-than-expected US jobs report, putting pressure on risk assets.
🚨In the past week, BTC has dropped over 20% and is trying to retest critical support levels. Many traders are worried about selling pressure from ETF funds and the shift of capital into the AI frenzy.
Analysis from Liquidation Map
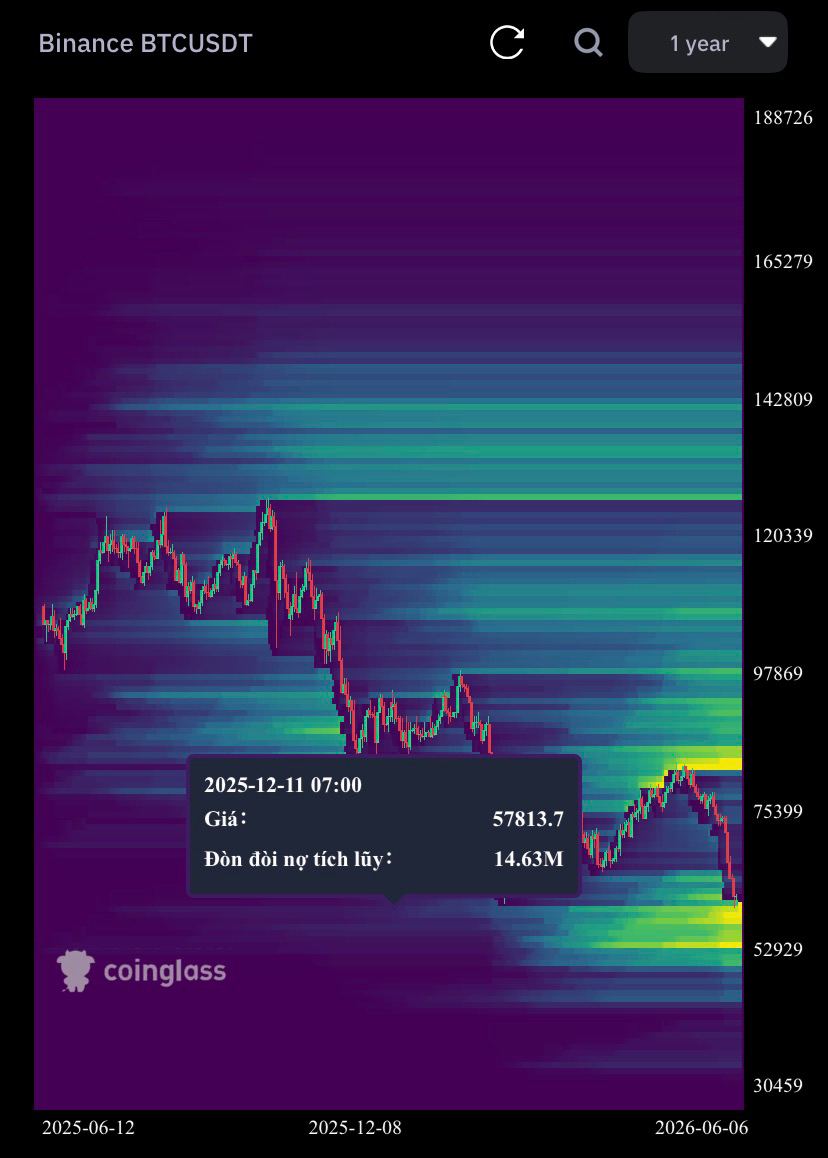
Based on Liquidation Map data, we see a dense liquidity concentration at lower price levels than current. The "whales" are watching the market's reaction at these price points to trigger liquidation orders or accumulate.
The price approaching key technical support levels (like the 200-week SMA) is currently the focal point for analysts. This area often witnesses historical reversals in previous cycles.
🧐 Expert insights & Sentiment:
The RSI index is currently at a very low level (around 17.4), indicating extreme oversold conditions. Many indicators like Mayer Multiple and SOPR are at historical lows, creating a potential accumulation setup for long-term investors.
Despite short-term fears, large institutions like Bernstein remain optimistic about the long-term target for Bitcoin.
Advice for the community (Digital Finance Station):
The market is in a "patience test" phase. Don't rush to catch a falling knife while volatility is still high.
Focus on risk management, reduce leverage if necessary, and closely monitor liquidity zones on the heat map for the most informed trading decisions.
⚠️ WARNING & DISCLAIMER
Content nature: All analyses and opinions (including information sources shared internationally) are for reference only. This is NOT investment advice or a profit guarantee.
Personal responsibility: The Crypto market carries high volatility risks. Always do your own research (DYOR).
Responsible investing is 🗝️ to sustainability!
#LiquidationMap #RiskManagement #MarketUpdate