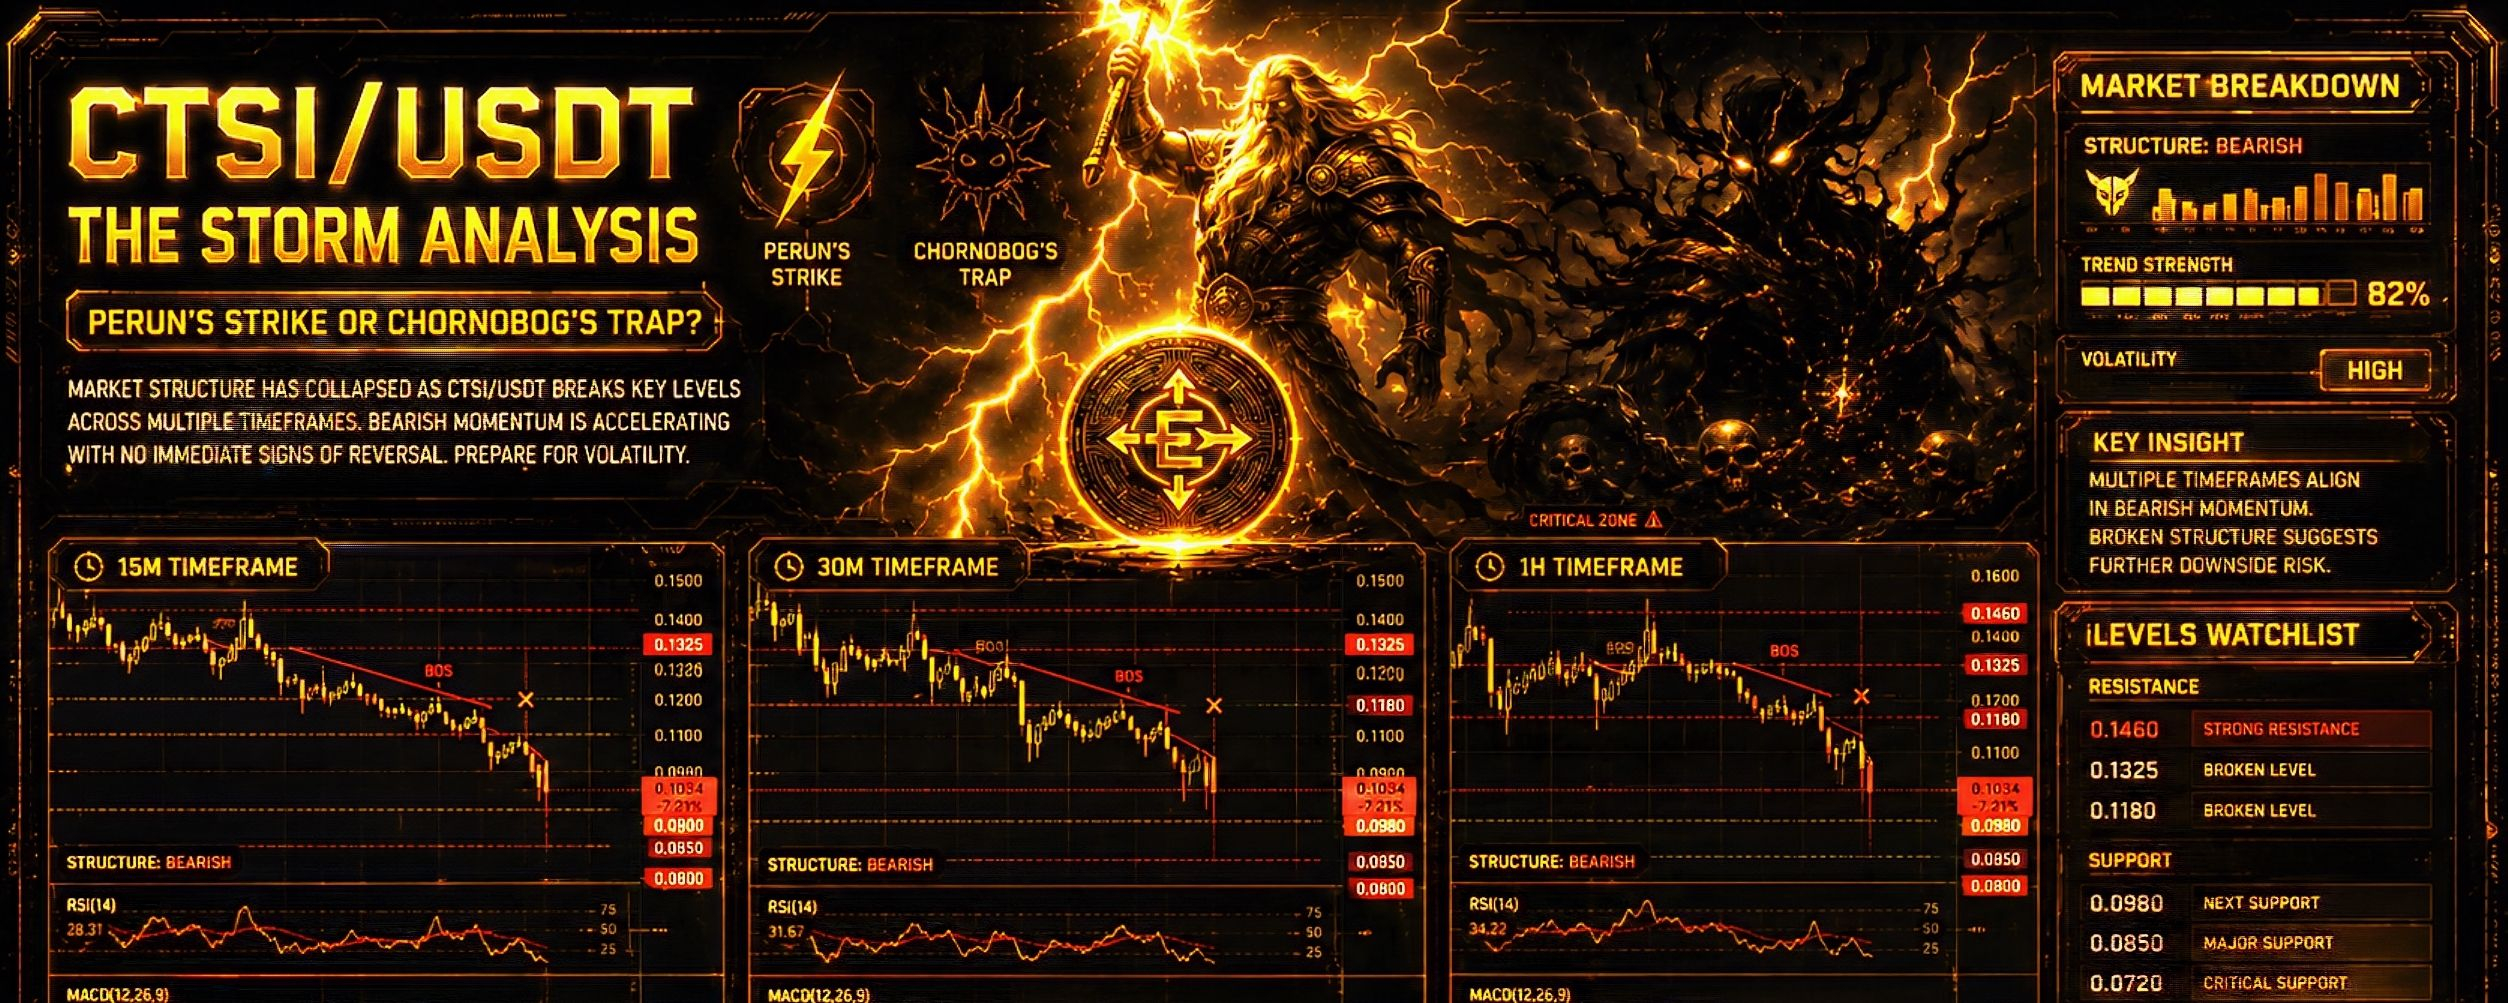
I see your requests. On the radar is asset #CTSI which just showed a classic impulse breakout — a lightning strike that broke through a long-term Fog (downtrend). Let's slice these three charts (15min, 30min, and 1hr) with our analytical tools to understand where the market wind is blowing.
⚔️ Technical Analysis Section
1. Lower timeframe (15 minutes) $CTSI
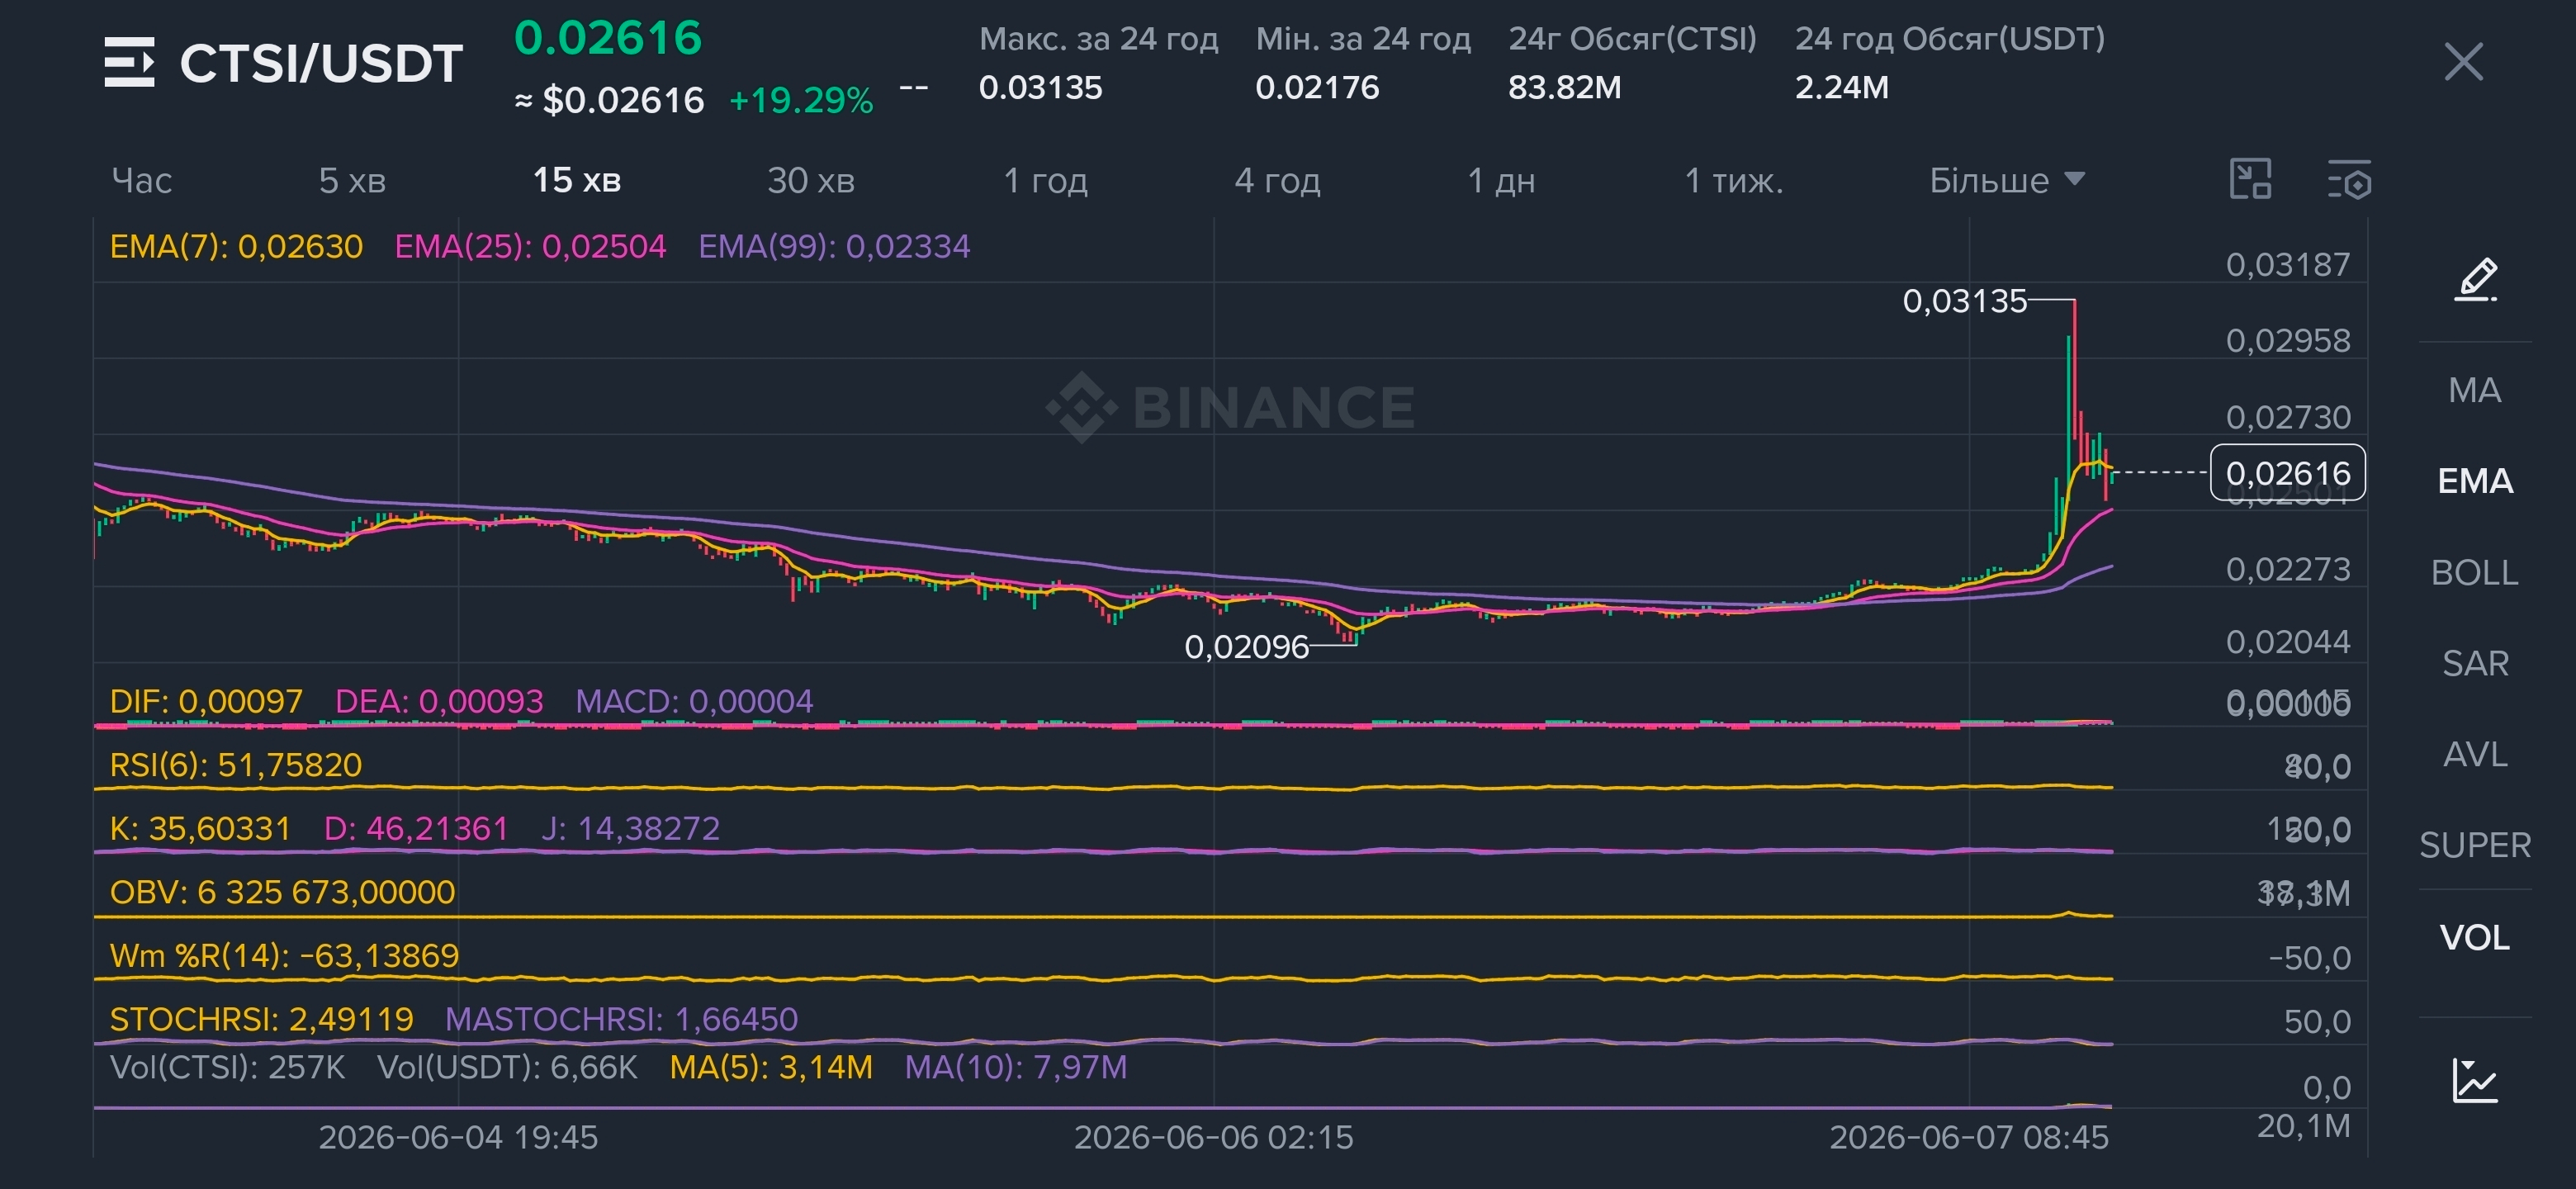
Structure Analysis: We see an aggressive price breakout to the local high 0.03135, after which a natural pullback occurred. Currently, the price is bouncing around the mark 0.02616.
Indicators: Price is squeezed between the fast EMA(7) (0.02630) and the medium EMA(25) (0.02504). The RSI(6) is at 51.75 — absolute parity, the strength of bulls and bears at the local moment is equal. However, the Stochastic RSI has already fallen into the oversold zone (2.49), hinting at a local cooling of sellers.
2. Medium timeframe (30 minutes) $CTSI
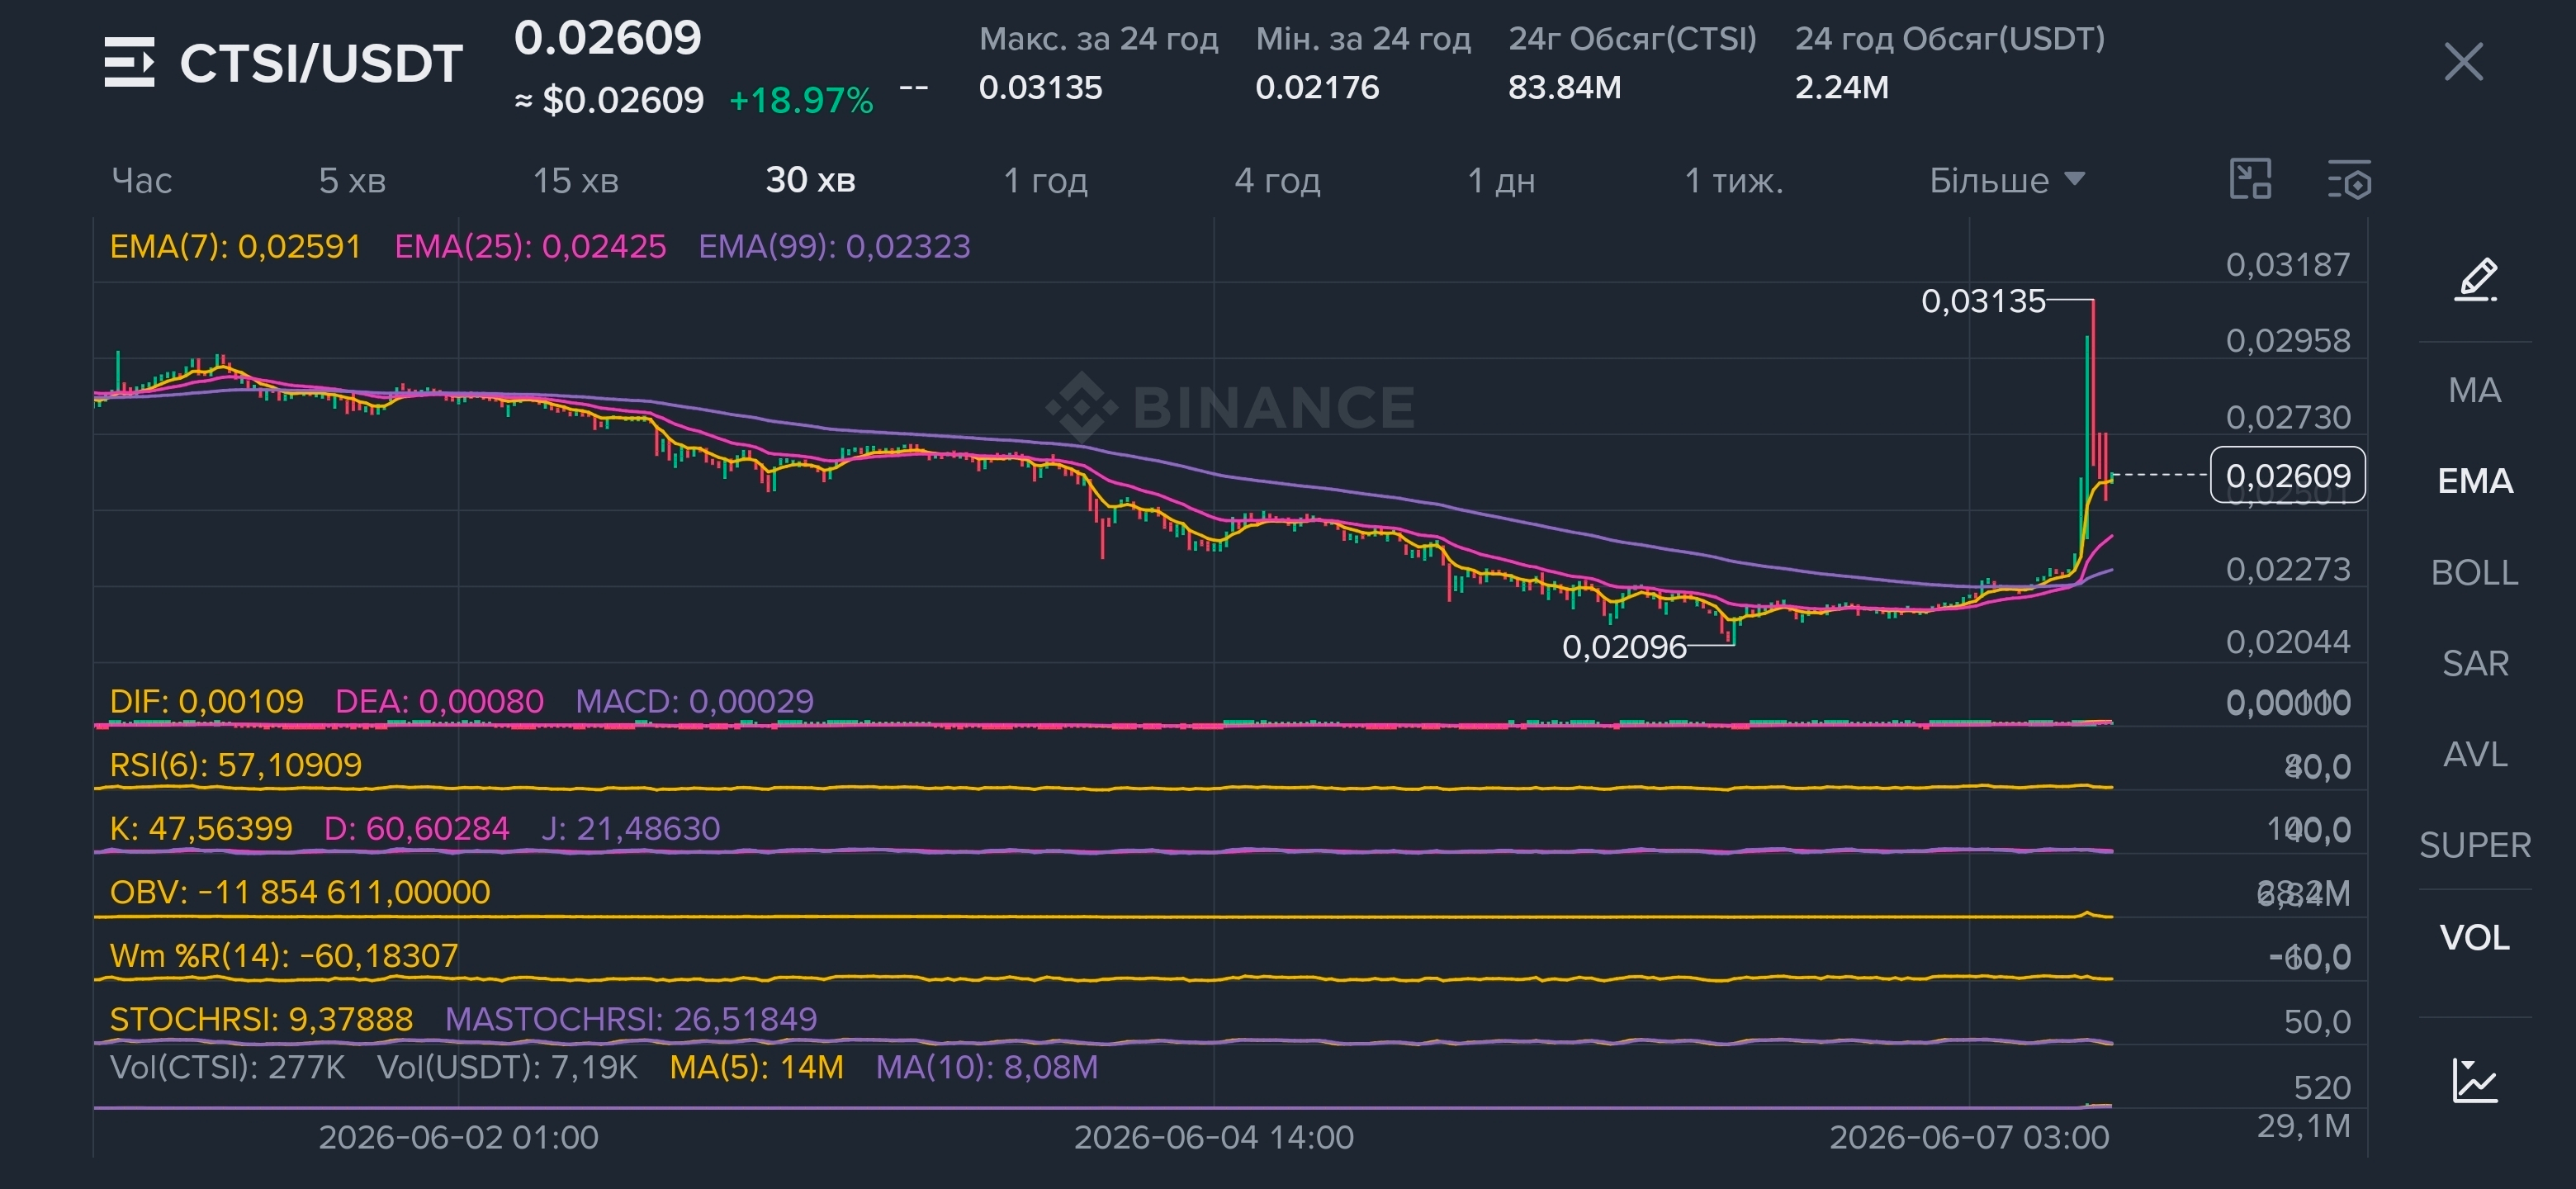
Structure Analysis: The current candlestick is fixed at the level 0.02609. The impulse was so strong that the price broke far beyond the heavy EMA(99) cloud (0.02323). The chart is currently testing EMA(7) (0.02591) from above as dynamic support.
Indicators: MACD shows the preservation of bullish momentum (green histogram, DIF > DEA), but the Stochastic RSI (9.37) also signals the end of the primary unloading wave after the pump.
3. Higher timeframe (1 hour) $CTSI
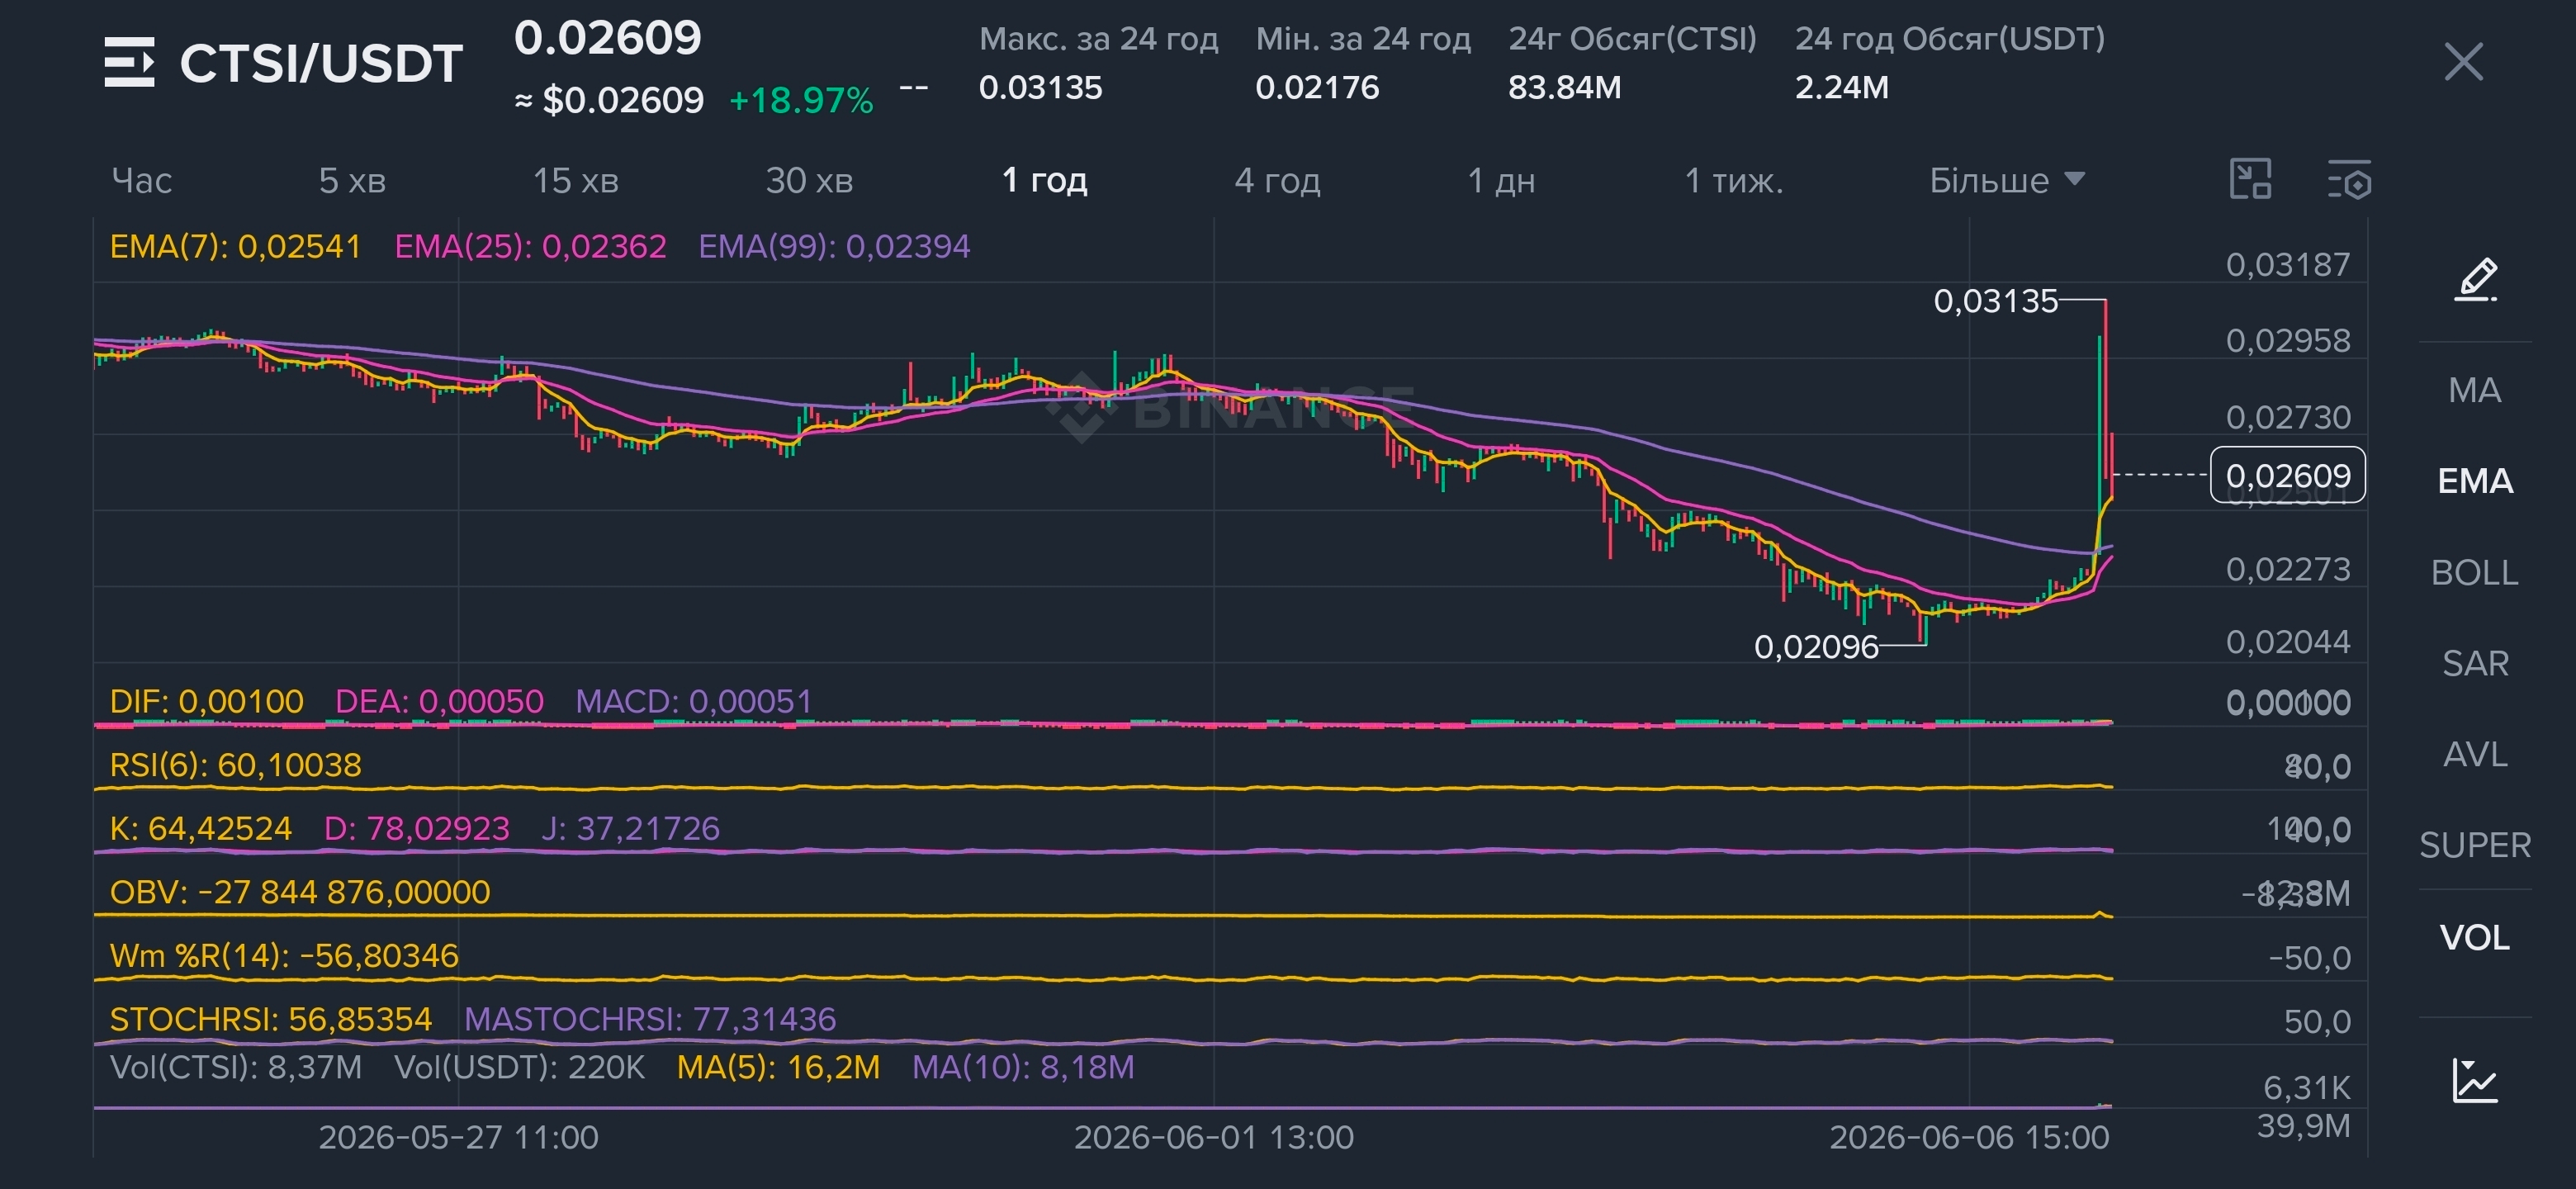
Structure Analysis: On the hourly timeframe, it is clearly visible how long the price accumulated at the bottom near the mark 0.02096. The pump candlestick broke through all moving averages (EMA 7, 25, 99) in one go. This is a sign of buyer strength at the moment.
Indicators: RSI(6) is at 60.10 — there is still room for local liquidity accumulation, but the Stochastic RSI (56.85) is turning down from the overbought zone. Buying volumes are colossal compared to the previous days of consolidation.
🛡 "Position Recommendation"
Current price (Entry point right now): 0.02609 – 0.02616
VERDICT: LONG (Short-term speculative bounce)
Smart money just pumped volume into the asset. Going short against such a strong impulse candlestick is suicidal (trying to stop a train with your hands). However, buying at the very top is also not advisable. The current price after the first 50% pullback from the impulse is appropriate for opening a long position, aiming for the formation of a second (lower) local high.
Risk Management (Important!): Entering a position should be done with caution (no more than 2-3% of the deposit), as after such vertical spikes the market remains extremely volatile and unpredictable.
🎯 Take-profit points
Don't be greedy — take your gains in parts when the market gives you the chance:
TP 1: 0.02750 (Local resistance, first take-profit at 30% of the position for safety).
TP 2: 0.02920 (Pre-high zone, take-profit another 40% of the position).
TP 3: 0.03100 (Testing liquidity zone near the peak of Perun's strike at 0.03135, closing remaining positions).
Stop-loss (Protective Shield): Close the hourly candlestick below the level 0.02400 (under EMA 25 on the 30-minute chart). If the price drops there, it will indicate that buyers are weak and the Shadow is reclaiming the asset again.
 CTSIUSDTPerp0.02328+4.16%
#cryptotrading #TechnicalAnalysis #BinanceSqaure
Hold your shields tight, manage your risks, and don't give in to emotions! ⚡️⚔️