Current Bitcoin price: 62947.18
BTC has re-entered the core resistance zone around 63000 after a series of upward fluctuations, but it hasn't managed to break through with significant volume. We're now in a crucial phase of 'high-level resistance + intensified long-short battle.' From the chart structure, the price remains within a bullish trend channel, but selling pressure from above is noticeably increasing. The market is in a typical 'risk of false breakout or confirmation pullback before a breakout' stage. According to candlestick indicators, volatility is starting to ramp up, indicating that the decision point is near.
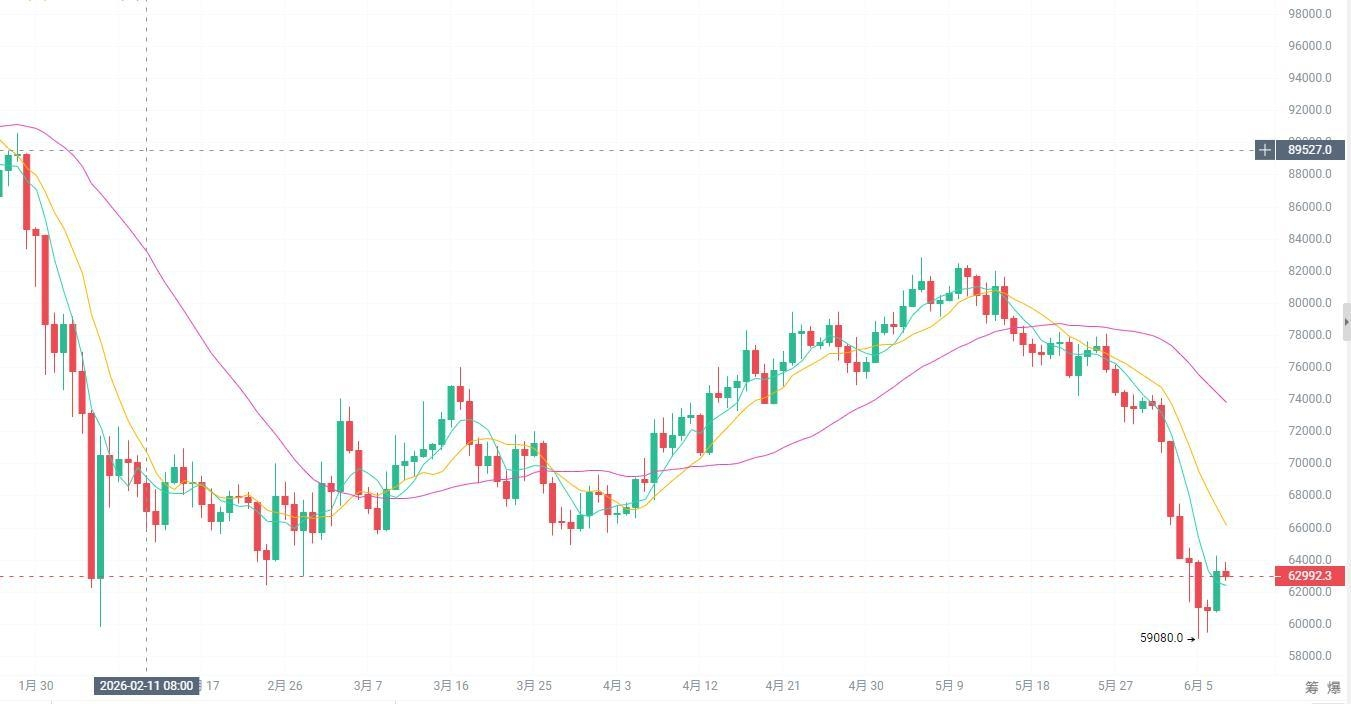 From a daily chart perspective, according to candlestick indicators, BTC is still in an overall bullish trend structure, with the moving averages maintaining a bullish alignment, and the price is slowly rising along the short-term moving averages. However, we are seeing consecutive upper wicks in the candlestick patterns, indicating significant profit-taking pressure around 63000. Currently, the daily chart is in a 'high-level consolidation phase within a continuing trend'; if it can hold above 63000 effectively, we could see a breakout into the 63500–65000 range; if it falls back below 61500, we will enter a daily-level high pullback correction structure.
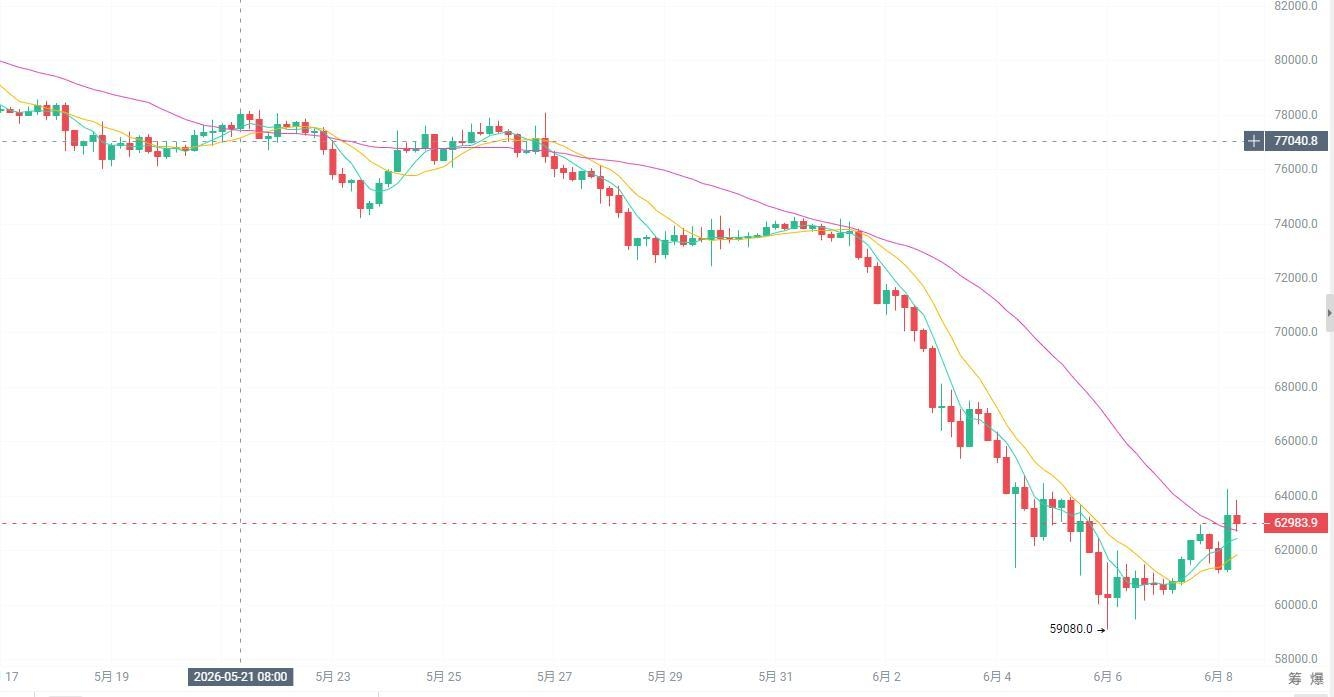 From the four-hour perspective, based on candlestick indicators, BTC entered a sideways consolidation after breaking the previous high, forming a typical 'high-range box + liquidity rotation structure'. Multiple attempts to breach 63000 have failed to sustain volume, indicating diminishing bullish momentum, yet bears have not established a trending pressure, placing the market in a re-selection phase after a balance between bulls and bears. RSI remains in a strong zone but is starting to turn down, suggesting short-term momentum is cooling off.
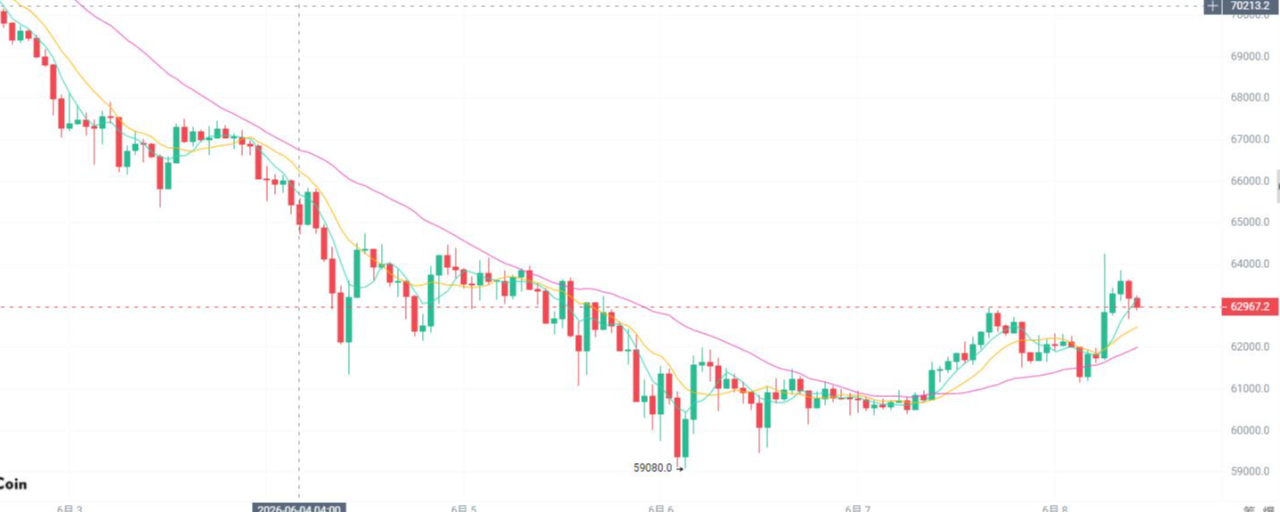
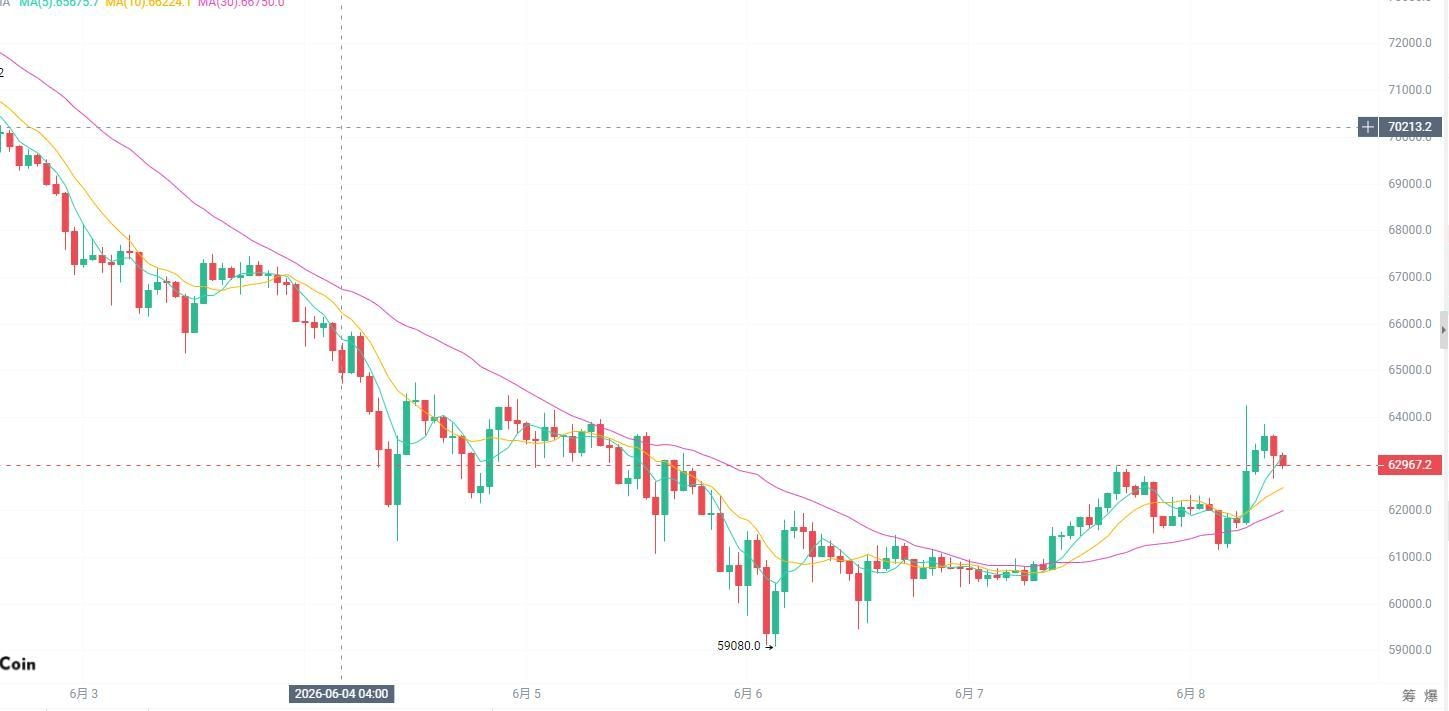 From the hourly perspective, according to the candlestick indicators, the short-term moving averages are starting to flatten out. Prices are oscillating between 62800–63200, forming a distinct short-term range structure. Volume has shifted from expansion to convergence, indicating the market has entered a typical 'post-breakout digestion phase'; any new volume spike will directly determine the short-term direction.
Overall, the daily bulls remain intact, with 4H high-level consolidation and the hourly chart entering a range-bound phase. BTC is currently in a 'critical choice window for trend continuation'; the direction hasn't changed, but the rhythm is entering a high-pressure zone.
📌 Real-time trading plan (open position at current price)
Direction: Short (betting on a high-level pressure pullback)
Entry price: 62947.18
Stop loss price: 64206.12
First take profit: 62317.71
Second take profit: 61058.77
Trading logic explanation
This trade is based on the logic of momentum decay following high-level pressure testing. The price has made multiple attempts in the 63000 area without achieving an effective breakout, while the 4H chart is nearing the end of high-level range consolidation, making it more likely for a downward pullback towards the mean in the short term.
This trade does not represent a trend reversal but rather a 'pullback bet after high-level compression', focusing on capturing the liquidity retracement phase following a failed breakout, with small stop losses to gain short-term volatility space.
Key observations for the market ahead
Pay close attention to the 61500 support level; if it breaks and sustains below, the short-term structure weakens and may pull back to the 60000 area. However, if we see a new volume breakout above 63500, the logic for this short position becomes invalid, and BTC will enter a new acceleration phase.
In a nutshell: BTC is at the crucial watershed of 63000, high-level consolidation is nearing its end, direction remains unchanged, but volatility is about to amplify.