
The weekly chart has flashed a bullish divergence signal for only the second time in history, the first being during the bottoming phase after the FTX collapse in 2022, which led to a massive upward rally. The current signal reappearing suggests the market might be approaching a similar structural turning point.
Recently, Bitcoin's price has been testing the 200-week moving average around the $60,000 mark repeatedly, a level widely regarded as the long-term bull-bear divide. Meanwhile, analysts are unusually united in their outlook for a key upward target around $93,000, which closely aligns with the $91,800 target mentioned in the latest updates (50-week moving average).
The most notable detail is that the current market presents both a 'weekly bullish divergence' and a 'weekly bear flag breakdown,' which point to extreme targets of $90,000 and $50,000 respectively. This significant divergence in technicals reflects the intense standoff between bulls and bears at key moving averages, exposing the fragility of market consensus through contradictory technical indicators. The ultimate direction choice will determine whether this is a deep squat jump or a complete trend reversal.
On June 8, Bitcoin's weekly chart displayed the second bullish divergence signal in history, sparking market expectations for a new wave of upward momentum. Analysts believe that if history repeats, Bitcoin could challenge the area above $90,000.
Data shows that Bitcoin's weekly RSI indicator has rebounded above 34 after breaking below the oversold level, while the price concurrently dropped from $75,800 to about $63,000. The price continues to make lower lows, but the momentum indicator has formed higher lows, creating a classic bullish divergence, indicating that selling pressure is weakening.
The last similar signal appeared after the FTX collapse in 2022, when Bitcoin started its ascent from around $15,500, ultimately rising to about $126,200, achieving a total gain of over 700%.
From a technical standpoint, analysts believe that Bitcoin's first important target is near the 50-week moving average, around $91,800. Meanwhile, Bitcoin is still hovering around the 200-week moving average at approximately $62,000, a level that has formed significant bottom zones during previous bear markets in 2015, 2018, and 2020.
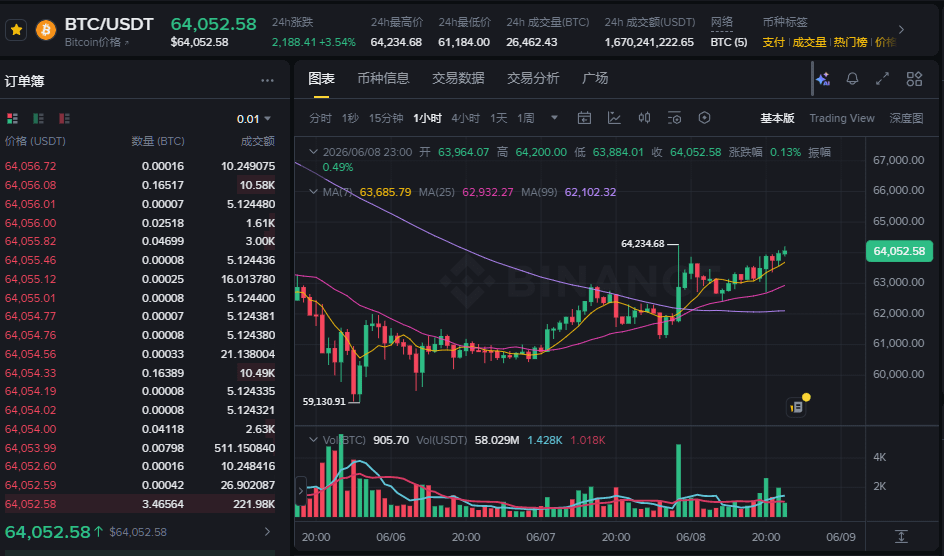
Crypto analyst Michael van de Poppe states that the 200-week moving average is an ideal area for long-term positioning, but bulls need to first break through the resistance zone between $64,000 and $65,000. If successful, Bitcoin could further surge to $71,500 to $73,000 and eventually fill the CME gap around $79,000, with the next major resistance area above $90,000.
However, the downside risk is still present. Reports suggest that Bitcoin is currently in the breakdown phase of a weekly bear flag pattern. If this pattern continues to unfold, the theoretical target for BTC may point below $50,000. Analysts believe that only by reclaiming support along the bear flag can the market effectively alleviate further downside risk.$BTC