📉 Bearish structure is clear. Looking at the chart, these points are evident:
Descending Channel (Gray Lines)
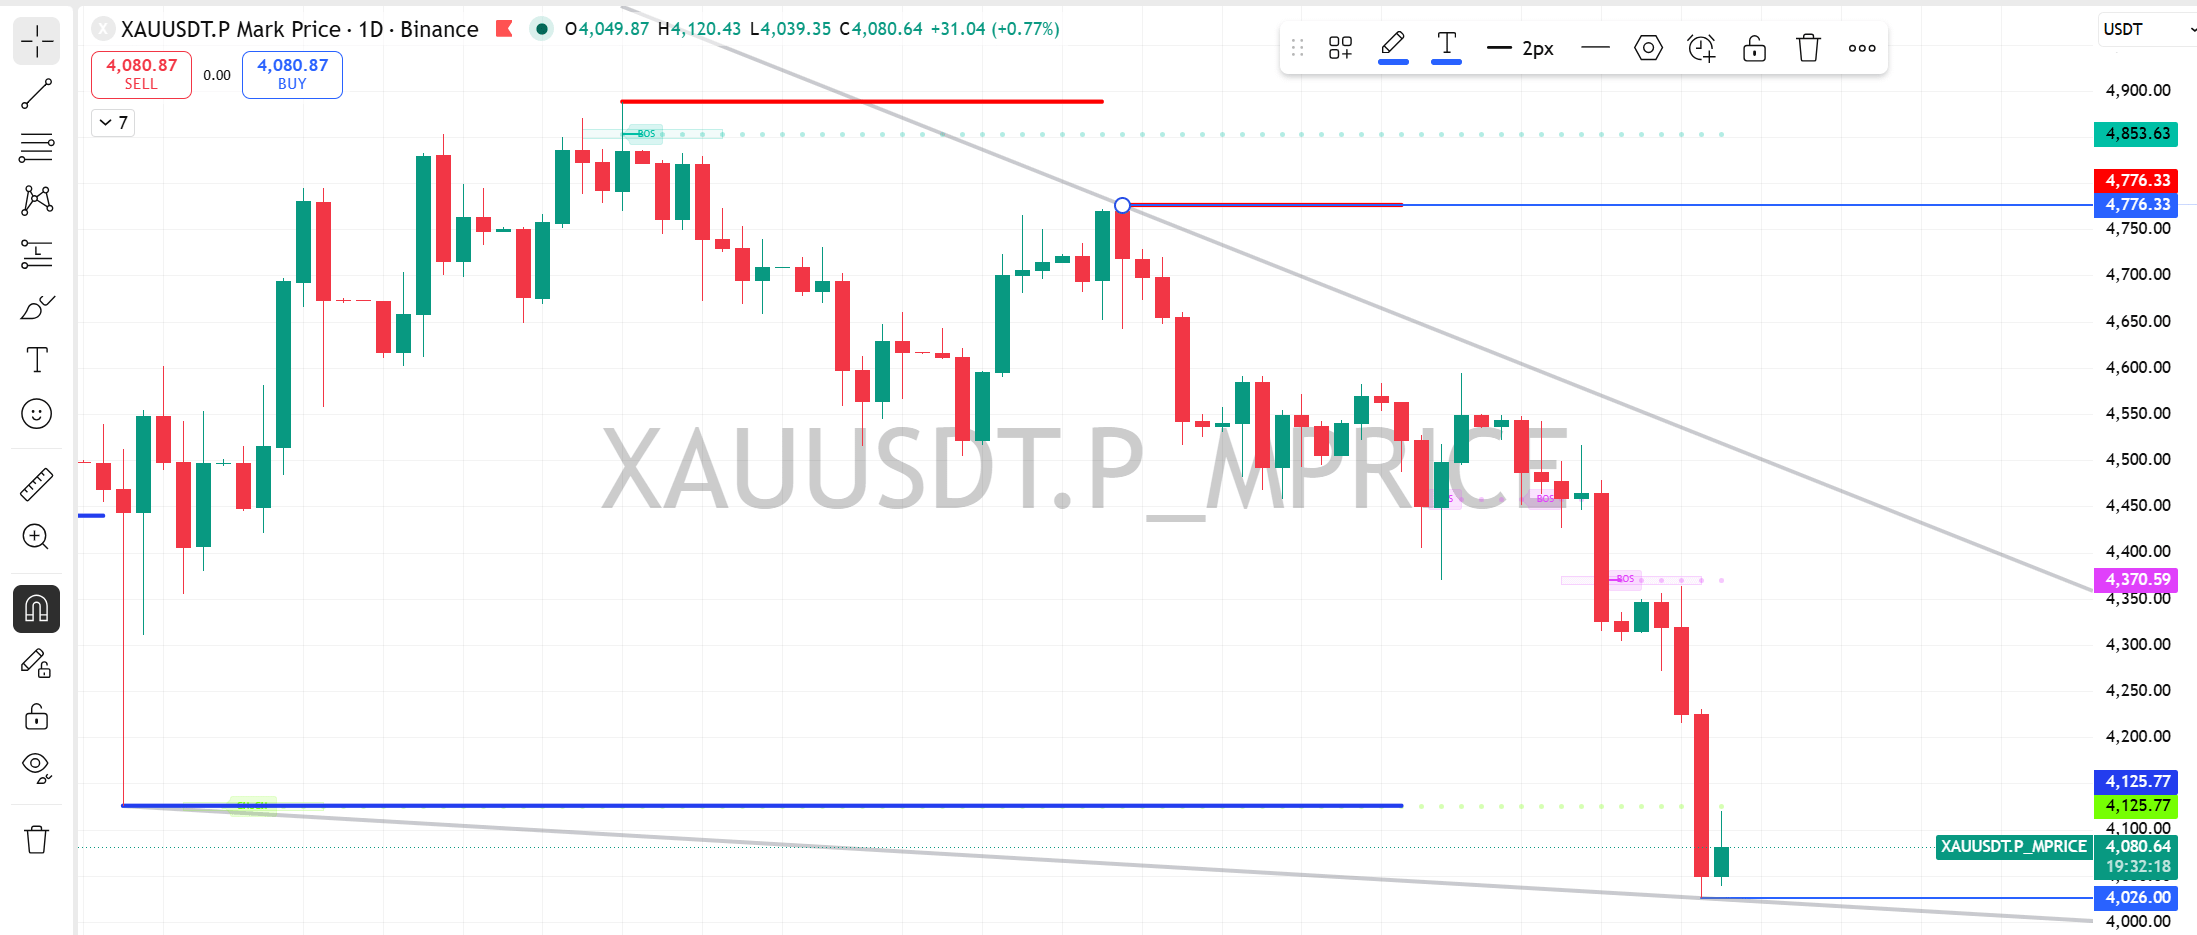
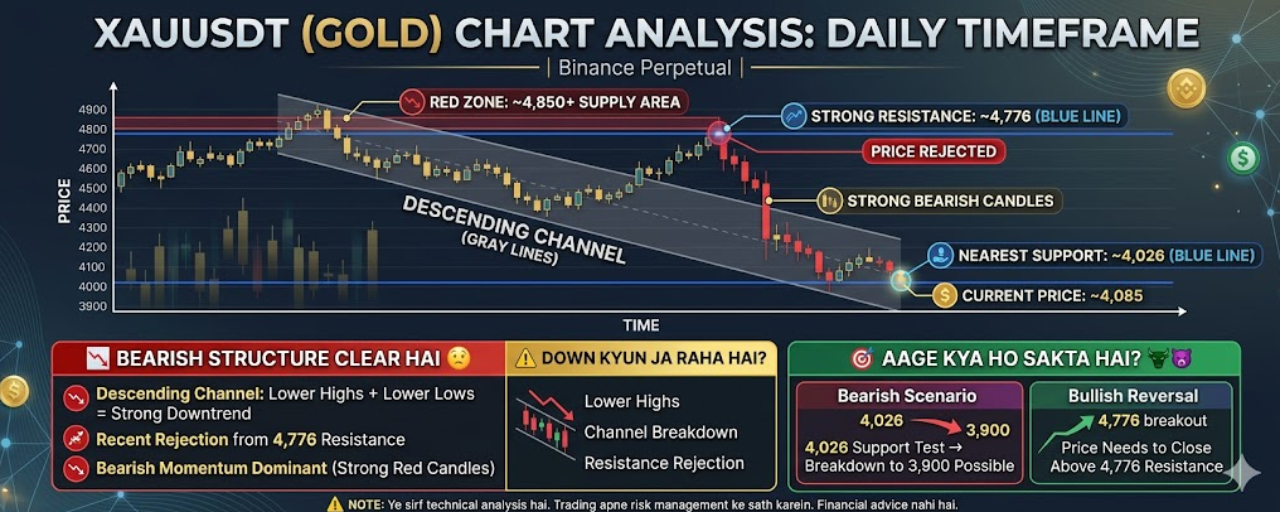
Price is within a descending channel, creating lower highs and lower lows → strong downtrend.
Key Resistance Levels
🔴 ~4,776 → Strong resistance (blue horizontal line) — price got rejected here 🔴 ~4,850+ → Upper red zone — previous supply area.
Recent Price Action
Price got hard rejected from the 4,776 resistance. After that, strong bearish candles formed, and the current price has dropped to ~4,085.
Support Levels
🔵 ~4,026 → Nearest strong support (blue line below) 🔵 ~4,125 → Minor support
⚠️ Why is it going down? ReasonDetailLower Highs: The recent rally is forming lower highs. Channel Breakdown: The bearish channel is still intact. Resistance Rejection: Strong rejection at 4,776. Momentum: Bearish candles are dominant.
🎯 What's the next move?
Bearish scenario: Testing the 4,026 support → If it breaks, 3,900 is also possible. For a bullish reversal: Price needs to close above 4,776.
⚠️ Note: This is just technical analysis. Trade with your own risk management. Not financial advice.