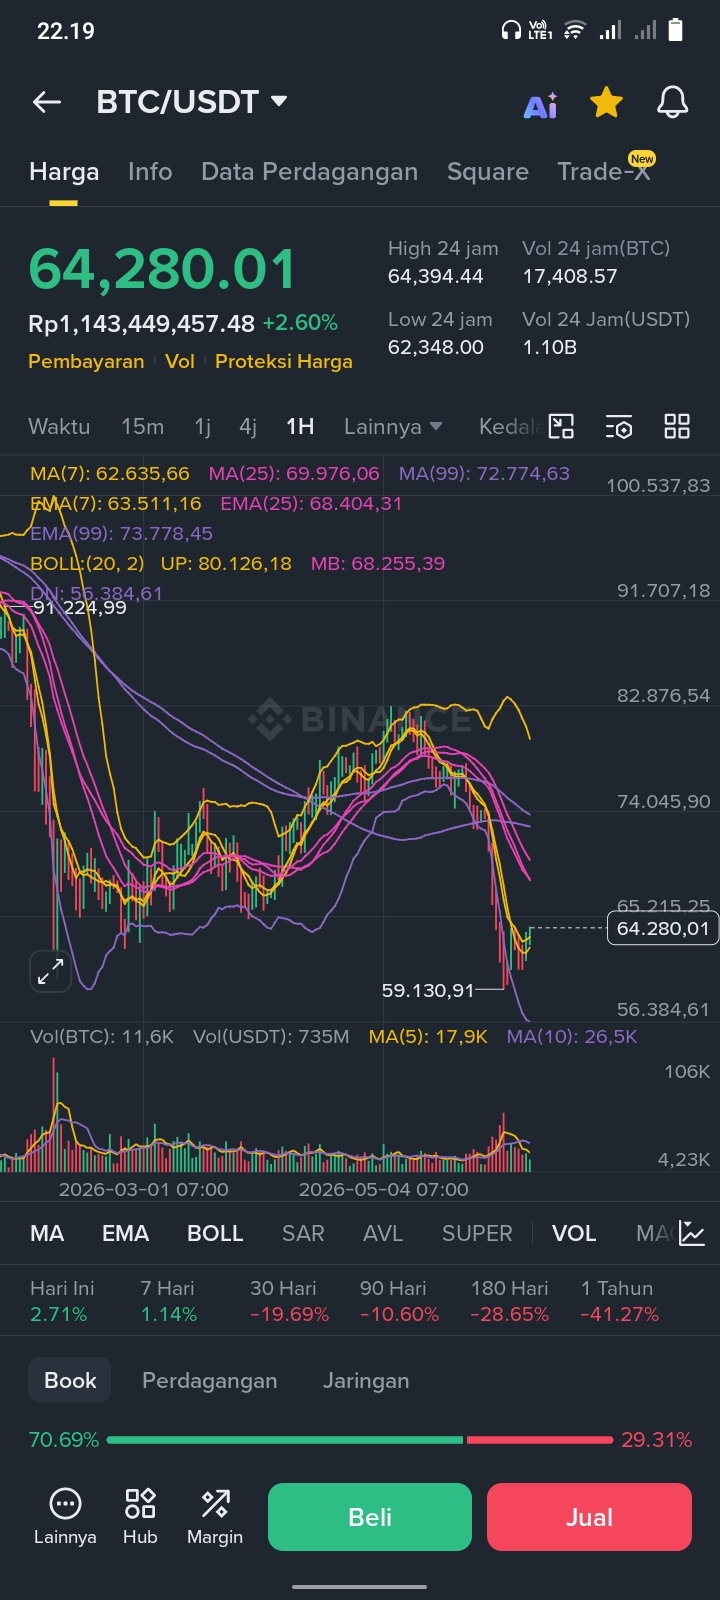
Looking at the BTC/USDT chart on the 1-hour timeframe.
Bitcoin is slowly starting to crawl up to $64,280 after previously being pressed down to a daily low of $62,348.
Right now, the price is trying to test the nearest Moving Average (MA) indicator. The 24-hour trading volume is looking pretty solid at 1.10B USDT, indicating buying pressure to prevent a deeper drop.
Nearest Support: Range of $62,300 - $62,800.
Nearest Resistance: Testing the $65,200 area (dashed line on the chart).
What's your take? Is this rally a bull trap or the beginning of a reversal? Let’s discuss in the comments! 👇
#BTC #CryptoAnalysis #BinanceSquare #Bitcoin#TradingSPOT