Hey, what’s up traders? Today I want to talk about COT data and how I personally use it to understand what the market is preparing for next. I have heard many times that COT is lagging.
And yes, if you look at it alone, without any market context, it can feel slow. But that is the mistake. COT is not there to give you a sniper entry.
🧪COT without context is just numbers. 🧪Price action without context is just candles.
It is there to show you what bigger players are doing behind the candles. When you combine COT with price action, market structure, key levels, and the latest swing, it can help you understand something very important.
Was the latest move a real reversal?
Was it only a pullback?
Is the market still in an uptrend or downtrend?
Or are we watching smart money slowly reposition before the next larger move?
🧪This is where COT becomes powerful. Recently, I used this exact logic to read the situation on EURUSD, GBPUSD, and the US OIL. I did not look at COT and say, “Okay, buy now” or “sell now.” That is not how I use it. I looked at what price was doing first.
Where was the market trading?
Was price near a CLS Range high or low?
Did we just see a manipulation?
Was the market pulling back into a key area?
Then I checked if the COT data supported the same story. So let's have a look at three recent examples. For more examples check my old COT post
🧪GBPUSD Example You can see price has been strongly dropping and then it starts to making a pullback around a 17th May, right? So price has been making a pullback and it has been going above a weekly range high, where it's slightly manipulated, right? And our goal is to decode what these pullbacks mean. Is it a start of a reversal or is it just a pullback in the continuation of a downtrend? So I'm looking at my tables in the left corner.
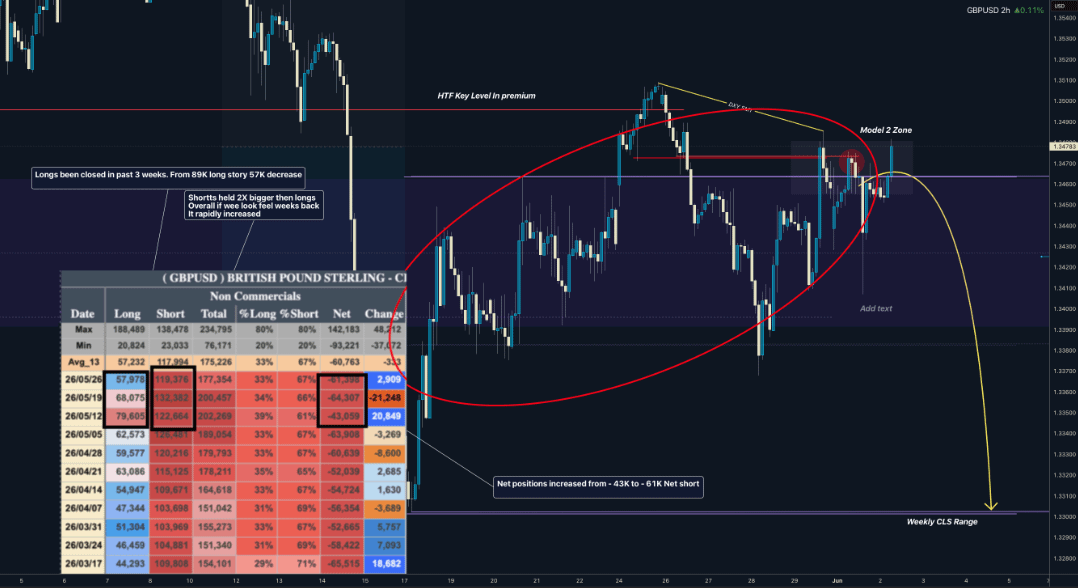
And we can see that in these three weeks when the price has been making the pullback, basically the market makers, non-commercials, that's the ones who are trading for a profit, they closed their longs from 79k to the 68k and then to the 57k, while their shorts positions still stayed around a 122 to 119. And you can see around a 19th May, they added some longs to push the price higher, right? So overall, with the net positions, we went from a minus 43k net shorts to the minus 61, right? So that's suggesting me that the bearish move will continue and this was just a pullback.
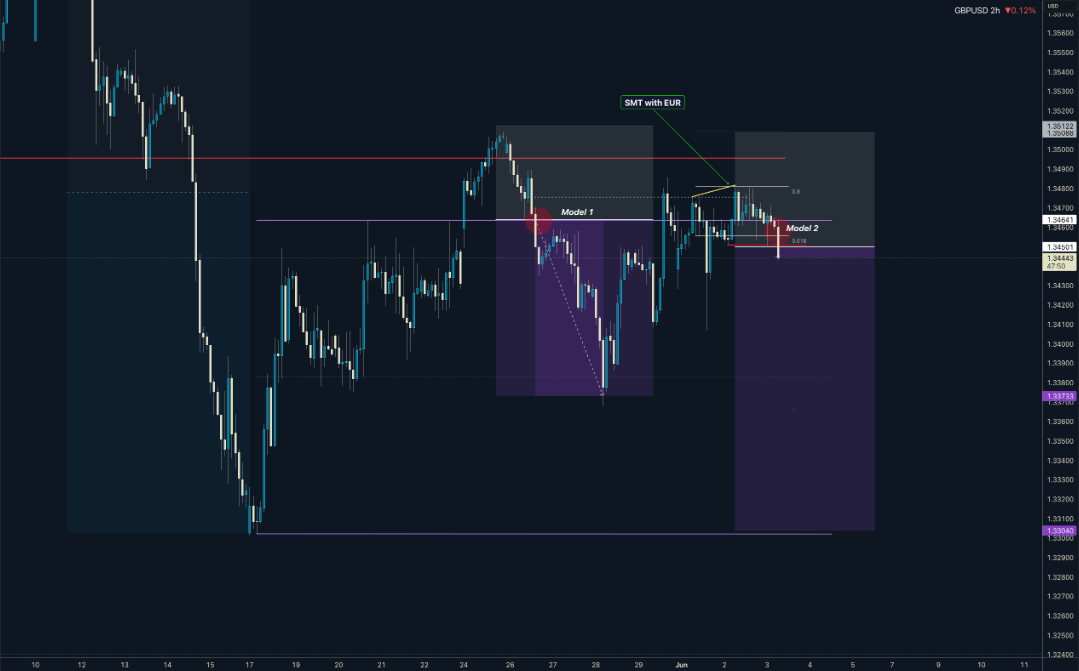
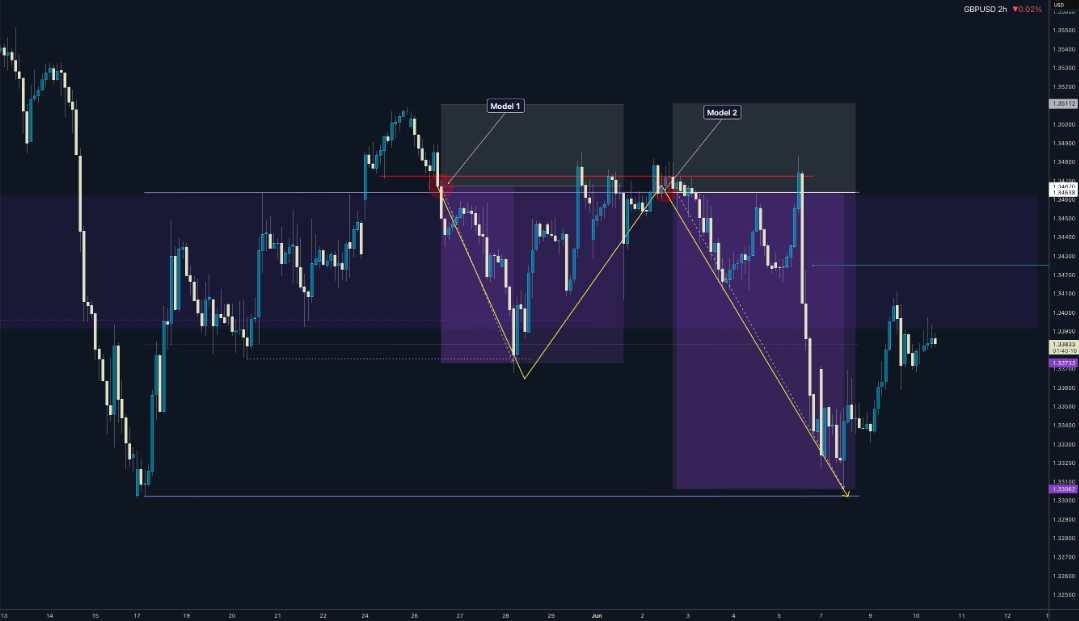
Hence, I analyzed the market with my CLS range context and I've been trading a model number one and also model number two.
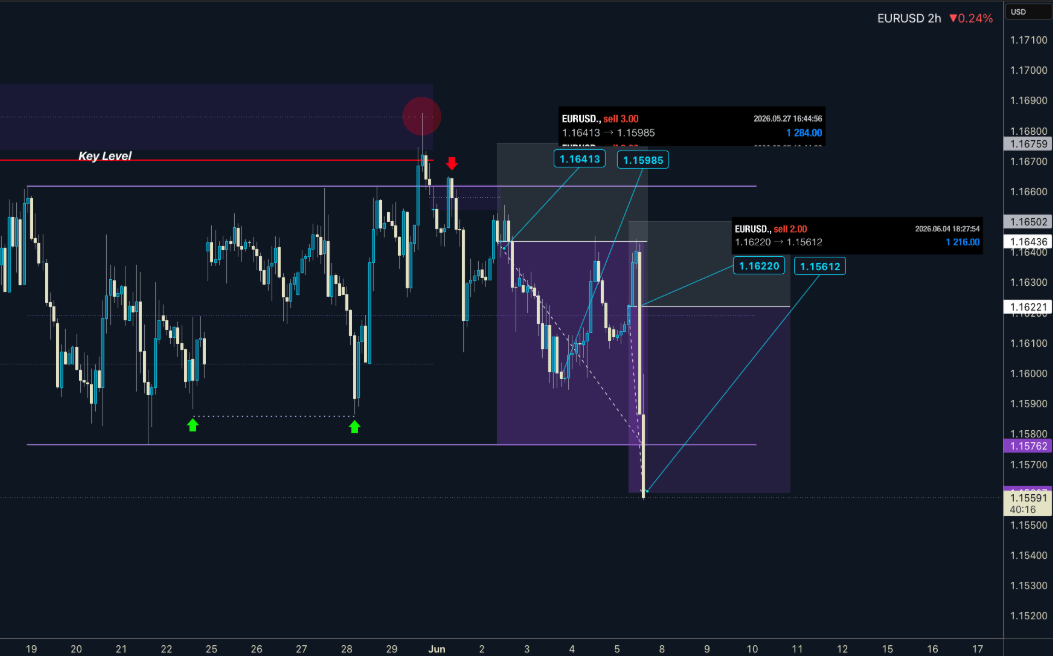
🧪 EURUSD Example
we can see how the price has been ranging for almost three weeks. And during these three weeks, I have been watching the COT data, and what we have seen is that basically the longs did not change that much, right? We can see that the longs basically has dropped from 224 to 223, which is not that big a drop, right?
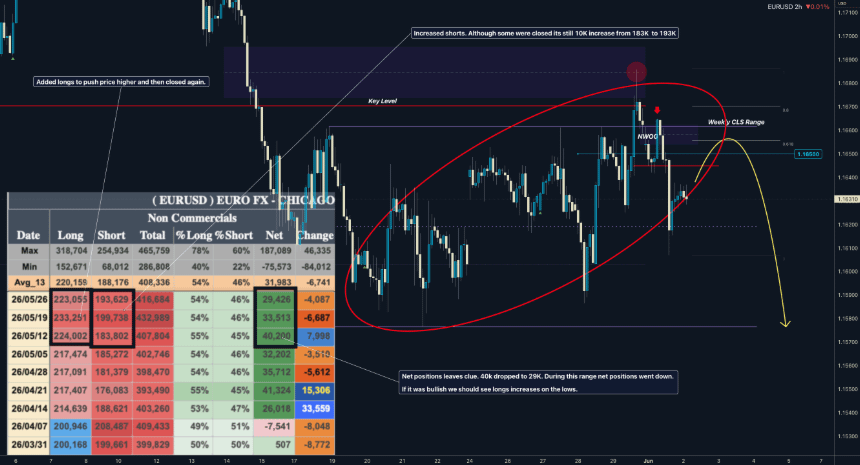
We can see slight increase temporarily to push the price higher. And what has actually happened in there when the price was higher, we can see that market makers actually added short positions, right? So that gave me the context with my CS range, which has been manipulated and we've been expecting price going lower, because also the net positions went from the 40K net positive to the 29K, which is 10K drop, right? So it's suggesting us that price is basically bearish.
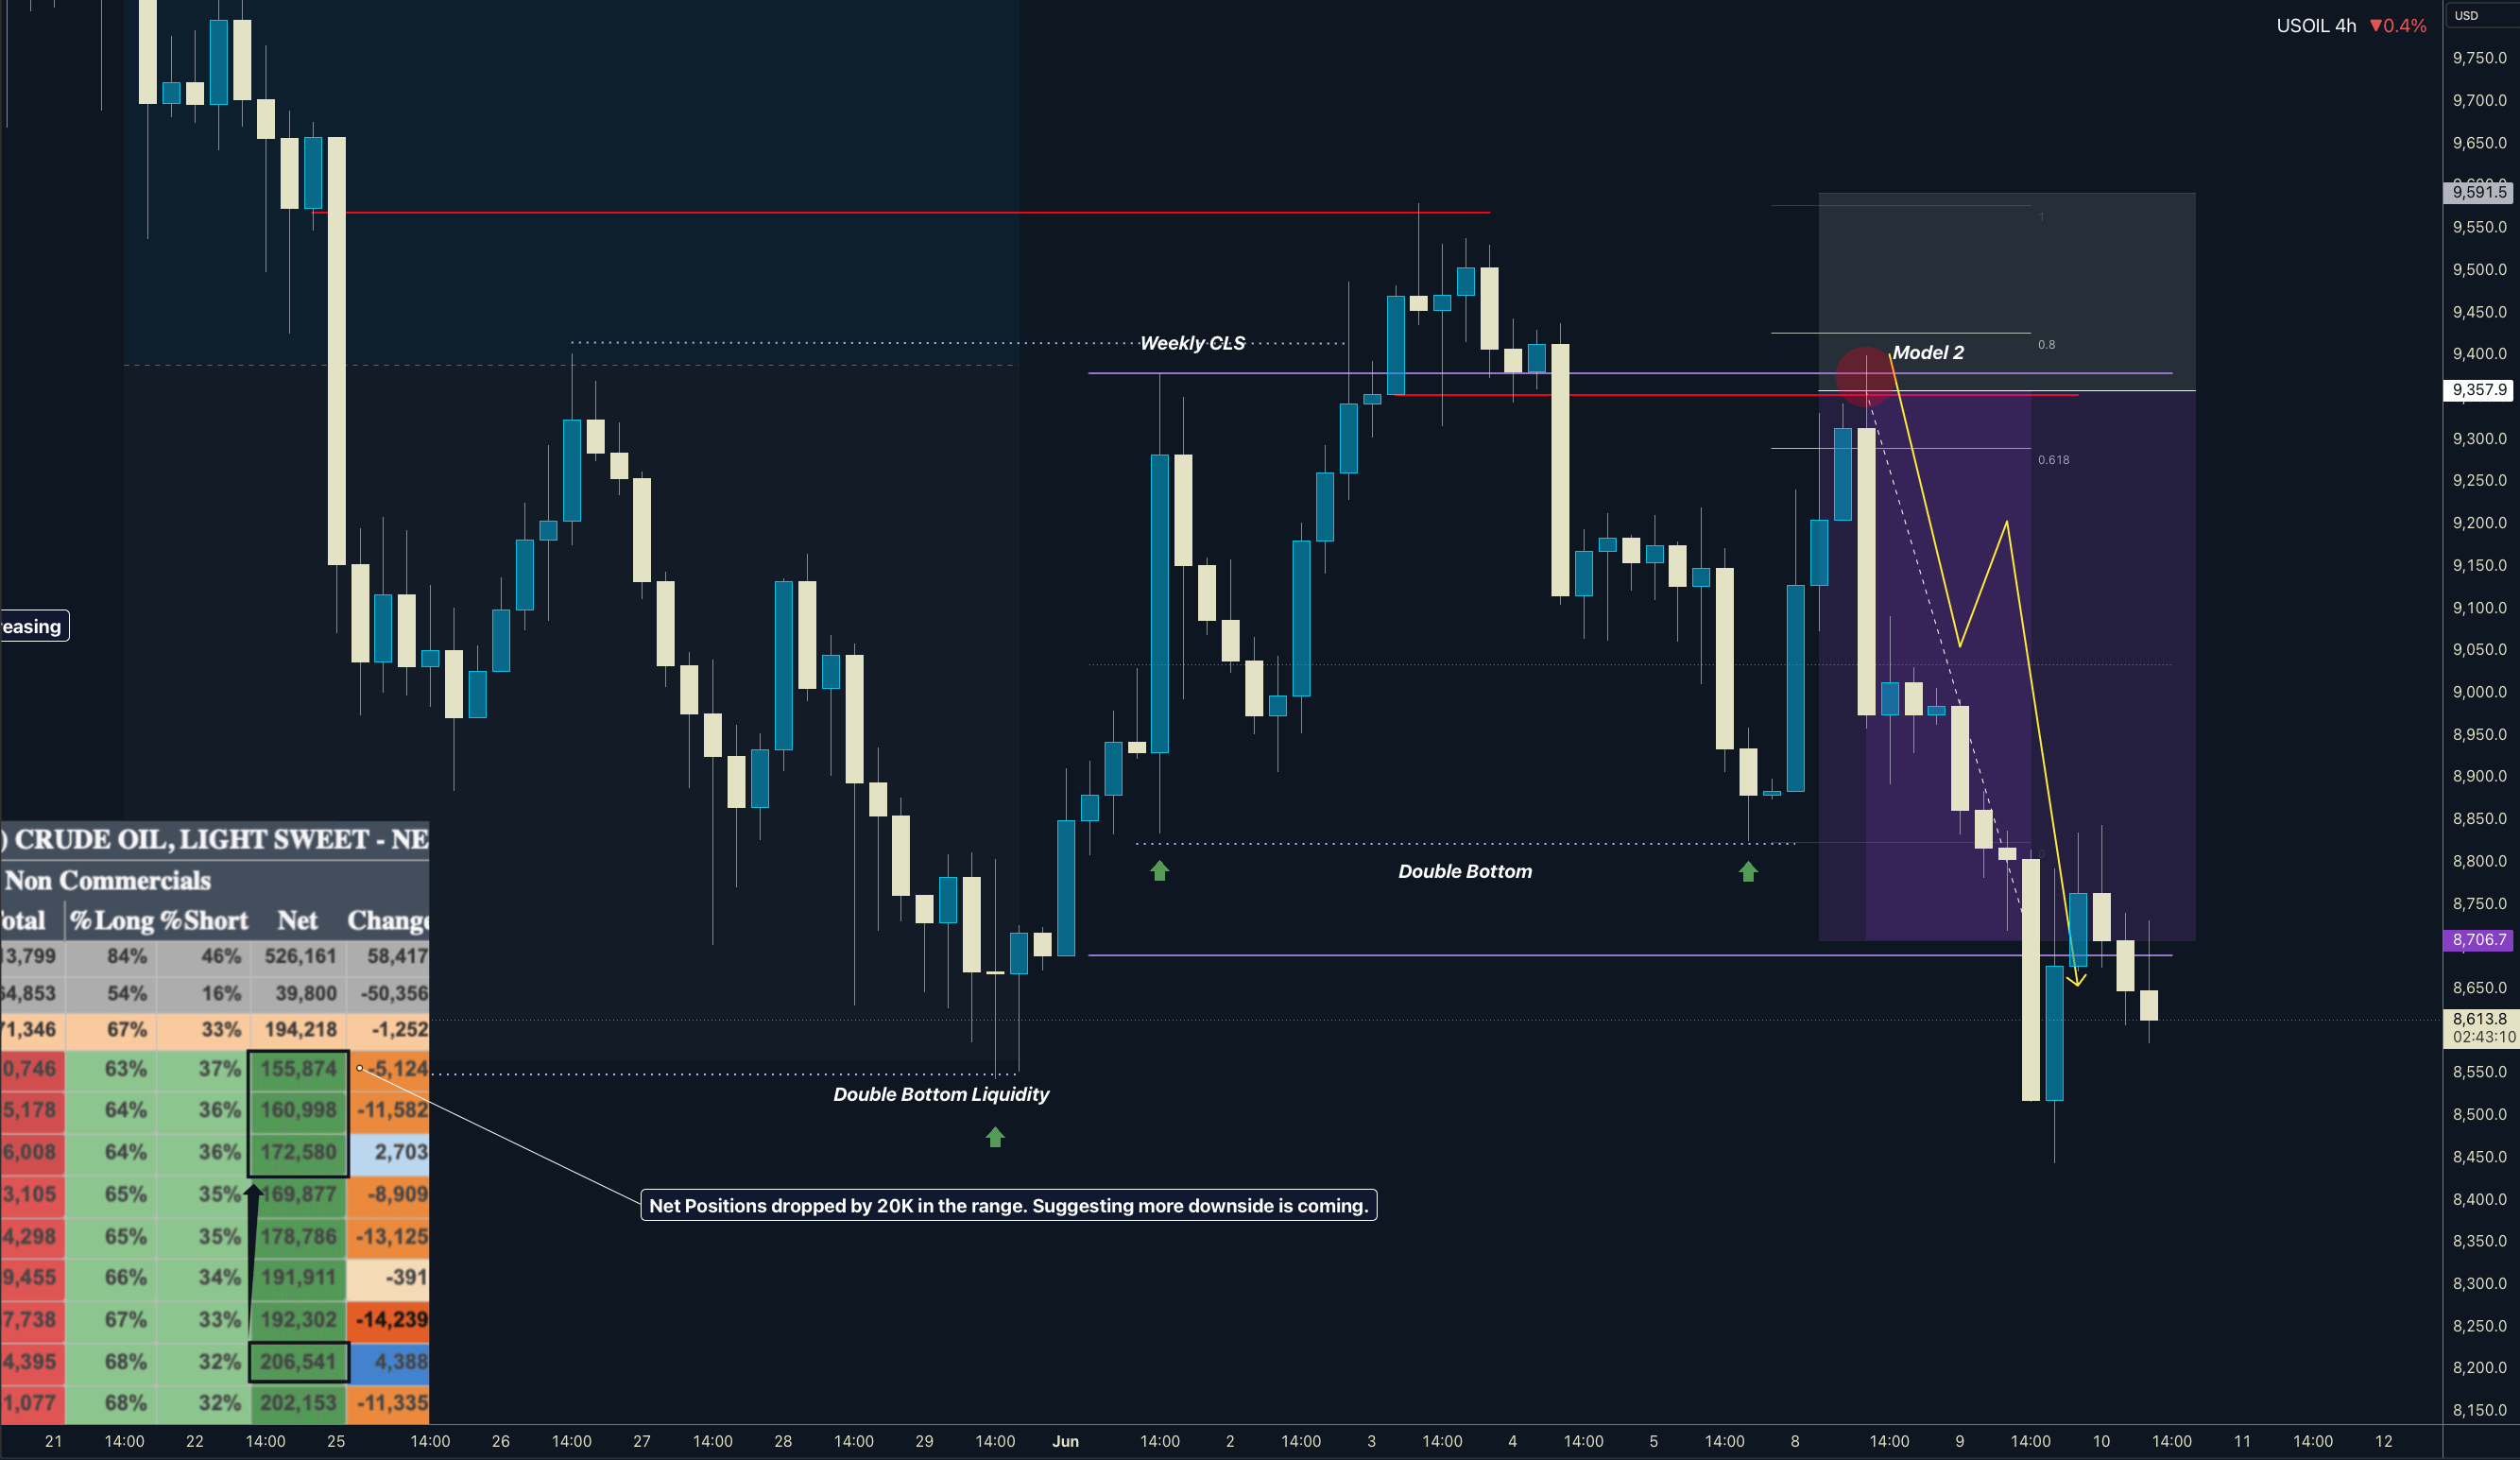
🧪 US OIL Example
we can see that the price has been dropping down and then it created a range. The big signal for me was a double bottom liquidity, which was below 8.5, right? So in here, we also can see that the new weekly range has been created, new CLS range, and we get the manipulation into an older block, which was been happening in the premium. I was also watching the COT data, and we can see that the shorts basically has increased from the 211 to 227K. And the longs has decreased from 384 to 383, right?
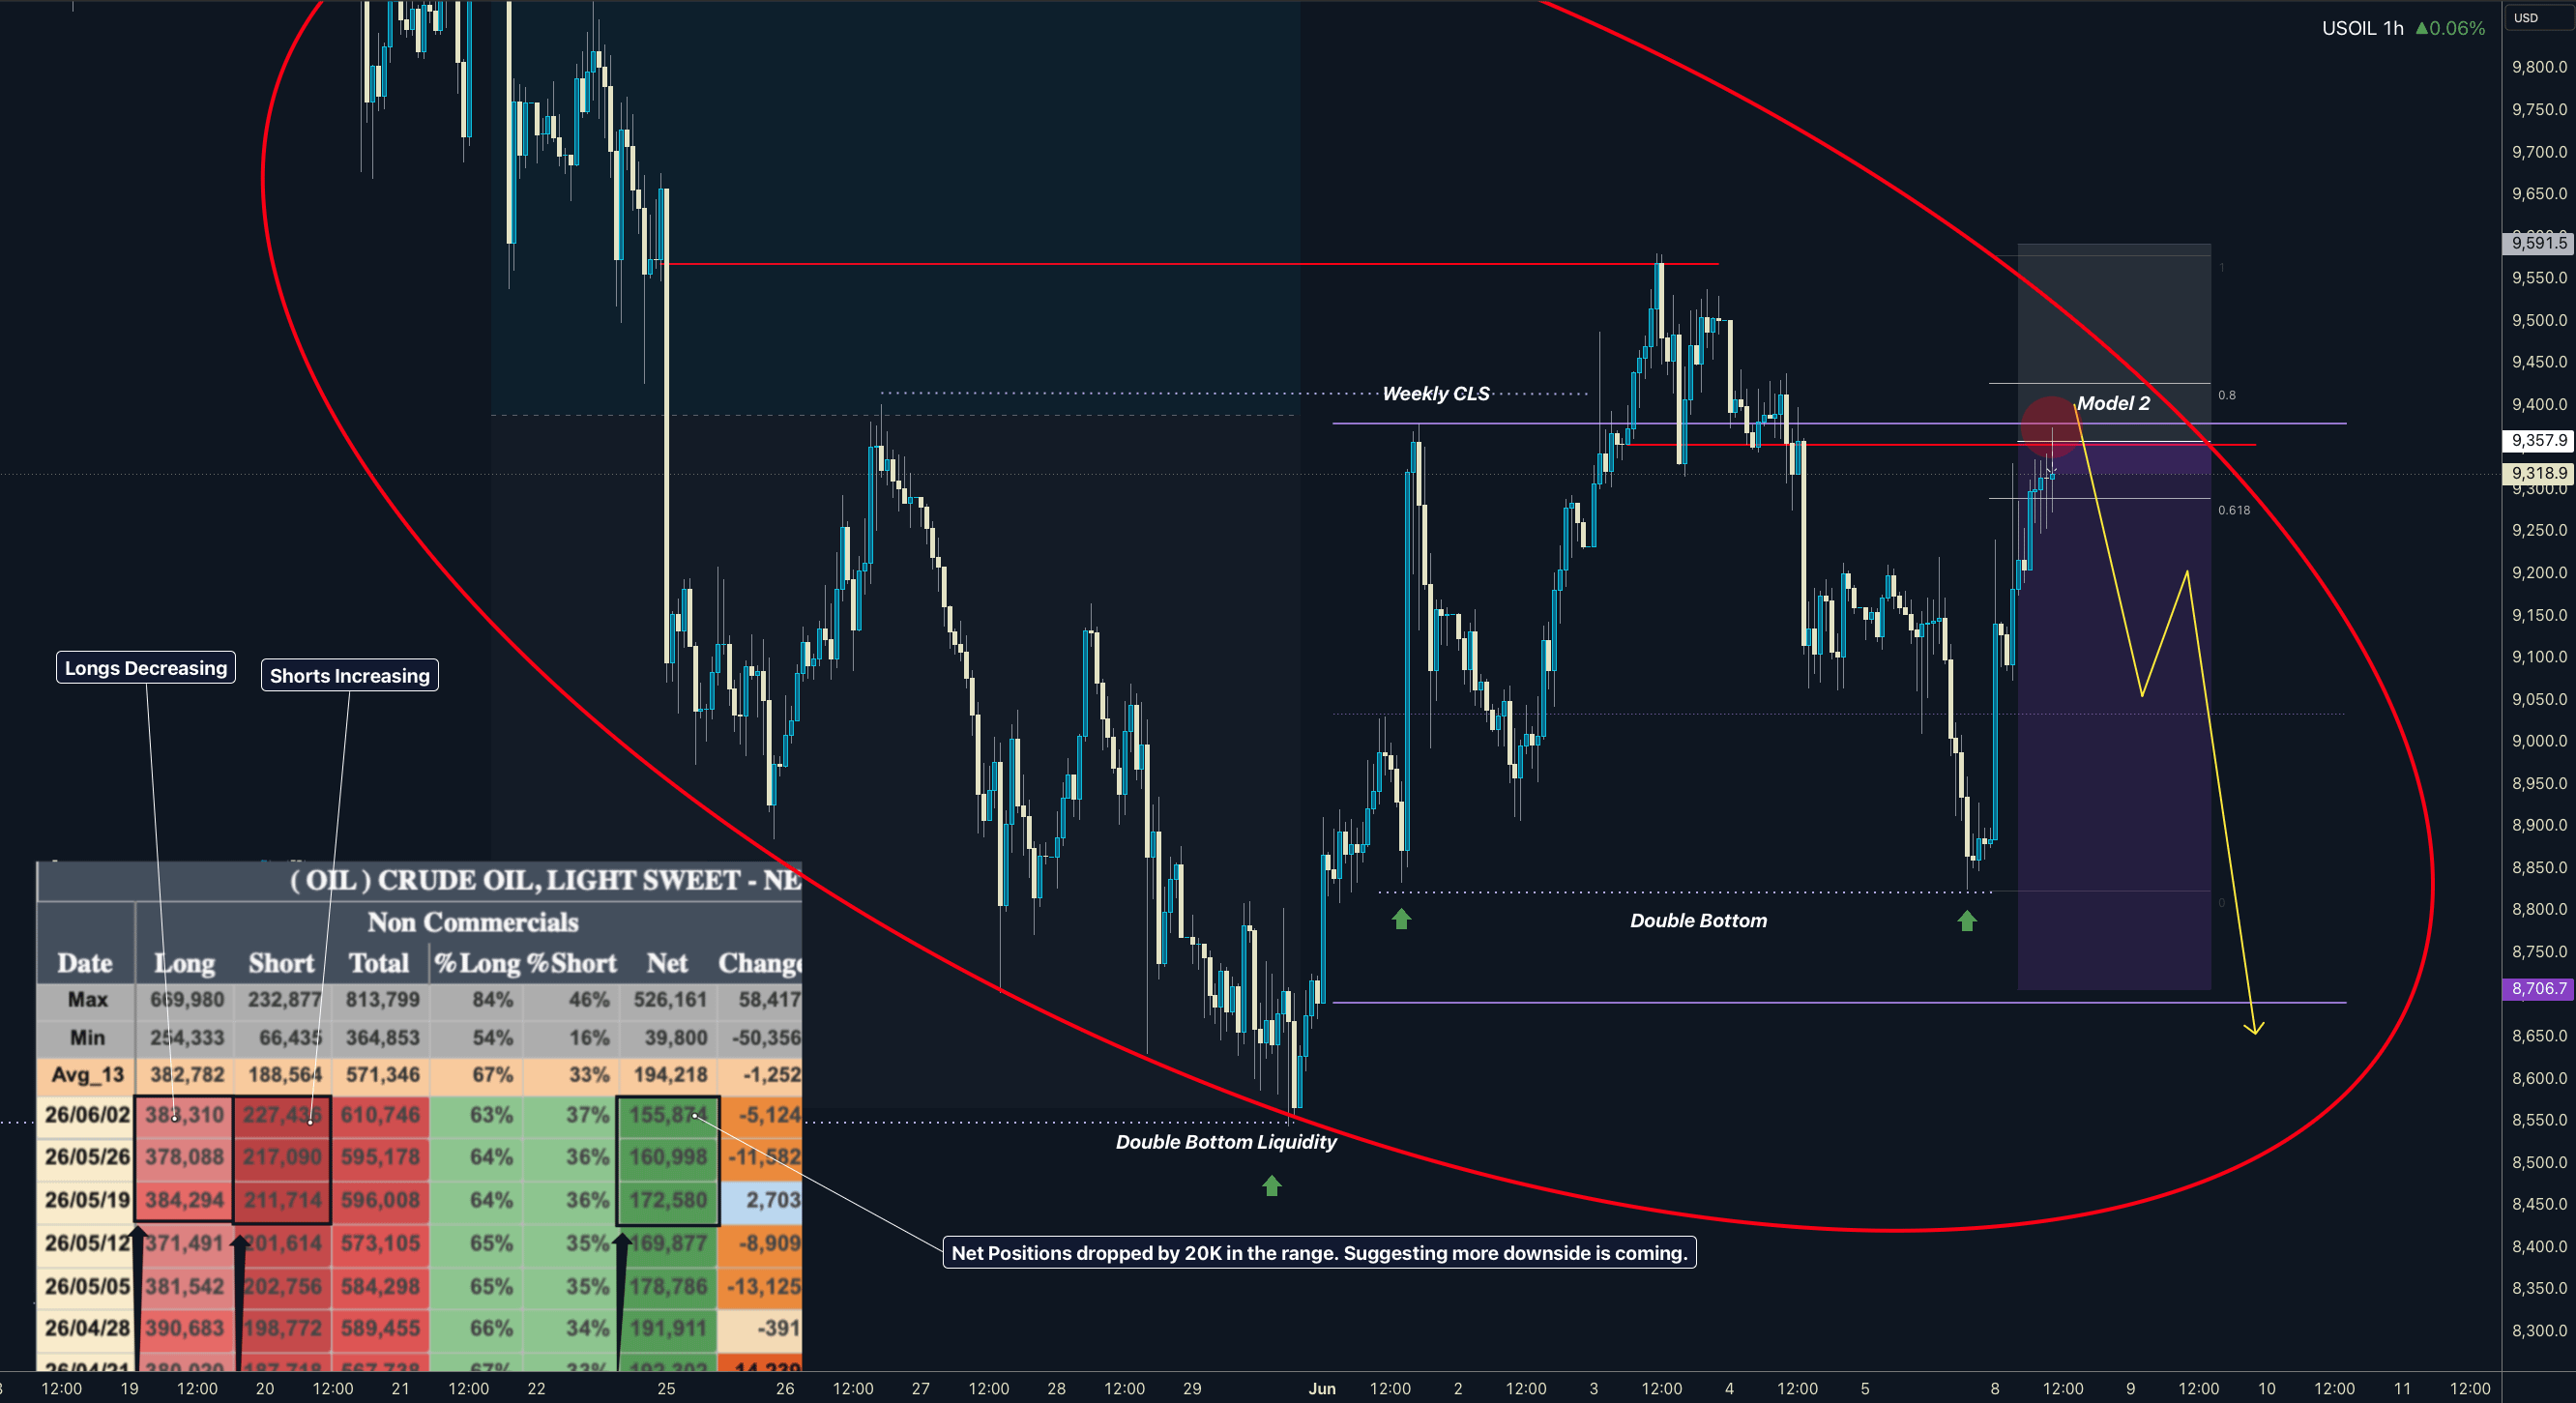
Overall, in the net positions, we can see decreasefrom the 172 to the 155, which is kind of 20K down, which is suggesting us that the price action is basically bearish. And it was just a question of the time until smart money positions materialize.
📚 Price Action without COT - order flow is just a part of story
But when you combine both, you can start reading the market like a story.
You can see who is trapped.. You can see who is accumulating.
You can see when a move is losing strength. And most importantly, you can avoid emotional decisions, because you understand the bigger story.
That is what gives patience. That is what gives confidence. Not as a magic tool.
But as a way to understand if the latest swing was a pullback, a reversal, or just another part of the bigger trend. Because when you understand what the market is really doing, you stop reacting.
And when you stop reacting, you finally start trading with a plan.
Hope this help you on your trading journey.
🚀Boost | 🔁 Share | 💬 Comment | ✅Follow for more Education
Adapt useful, Reject useless and add what is specifically yours.
David Perk