
The current spot and futures markets are showing a strong one-sided upward trend, with prices significantly above the medium to long-term moving averages and the market average holding cost. However, the futures market has seen a decline in trading volume and negative funding rates, indicating that after a rapid price increase, market enthusiasm for chasing higher prices is cautious, with a divergence between bulls and bears, not an extreme greed-driven broad market.
d
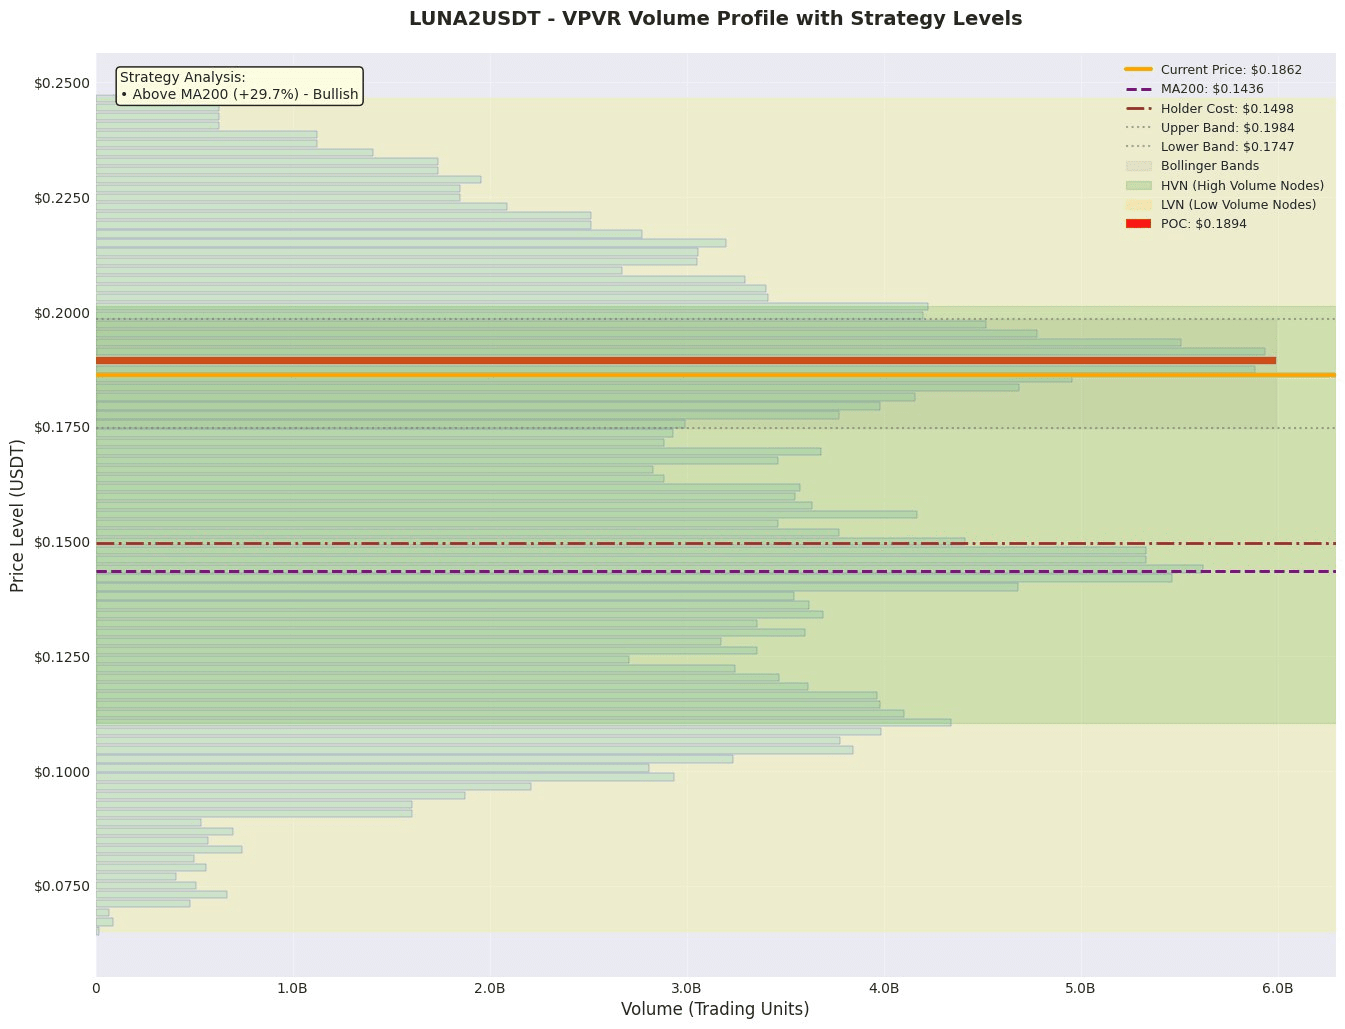
Key prices and range structure
1. Value anchoring zone: VPVR data shows that the current core value range of the market (Value Area) is from 0.1046 to 0.2071, with the POC (Point of Control) at 0.1894. The current price of 0.1862 is near the POC, meaning the price is testing the 'value center' of this trading round. The area above the POC to VAH (0.2071) forms a key resistance zone in the near term; if it can effectively break through, there may be upward space opened up; conversely, if the price is blocked near the POC, it may fall back to seek support within the value range.
2. Trend and Volatility Range: The current price of 0.1862 is significantly above MA200 (0.1436) by about 29.7%, positioned above the medium to long-term upward trend line, with a strong technical structure. However, the Bollinger Band position is at 48.6%, located in the lower area of the middle band, and the price is between the lower Bollinger Band (0.1747) and the middle band, indicating weak short-term momentum and a phase of consolidation or pullback after the rise, with the lower Bollinger Band (0.1747) constituting the first key support recently.
3. High Volume / Concentration Zone (HVN): POC (0.1894) is the most significant HVN at present, where price tends to fluctuate and compete. The Value Area (0.1046-0.2071) is an overall wide high volume area, indicating that the price may experience a prolonged period of consolidation and turnover within this range.
Derivatives and Liquidity Analysis
Based on market summary data, the analysis is as follows:
• Leverage funding bias and congestion: The funding rate is negative (-0.00126754), indicating that short positions in the contract market need to pay fees to long positions, with short-term bearish sentiment prevailing. The long-short ratio decreased from 1.1404 to 1.0388, showing that the advantage of long positions is rapidly weakening, and market sentiment has shifted from extreme optimism to caution. The OI/Market Cap ratio is as high as 149.38%, indicating a very high leverage level in the derivatives market, where market volatility may be amplified, posing a risk of chain liquidations due to sharp price fluctuations.
• Liquidity signal: The 24-hour contract trading volume plummeted by 43.3%, but open interest (OI) remained stable. This usually means that after a significant price fluctuation, there is insufficient new trading interest, and the market may enter a wait-and-see or profit-taking phase, which is not a typical liquidity exhaustion scenario (OI dropping sharply synchronously), but caution is needed regarding the decay of upward momentum.
• Leverage and Position Recommendations: Given the extremely high OI/Market Cap ratio and negative funding rate, the market is leveraged and sentiment is polarized. The current environment is not suitable for amplifying leverage. Traders should reduce their positions, adopt more conservative risk management, or wait for clearer trend signals.
News and Event Impact
News summary shows that Terra (LUNA) price has surged over 55% in the past week, mentioning that the 'Terra v2.18 upgrade' may be one of the driving factors. This news sentiment is significantly positive, directly reporting the strong performance of the price and possible positive fundamental progress, helping to maintain bullish sentiment in the market and attract off-market attention, providing narrative support for the short-term strength of the price.
Trading Strategy
Plan A: Conservative Pullback Long Strategy
• Direction: Long
• Entry Range: Wait for the price to pull back to the strong support area between the lower Bollinger Band and MA200, specifically the range from 0.1747 (lower Bollinger Band) to 0.1436 (MA200), considering entering in batches.
• Stop Loss: Set below MA200 or outside the key HVN (such as VAL at 0.1046), for example, 0.1400.
• Target: First target at POC position 0.1894, second target at VAH position 0.2071.
• Expected Profit-Loss Ratio: With an entry price of 0.1600, stop loss at 0.1400, and target at 0.2071, the profit-loss ratio is approximately (0.2071-0.1600)/(0.1600-0.1400) = 2.35.
Plan B: Aggressive Breakout Long Strategy
• Direction: Long
• Entry Range: Strong breakout with significant volume (substantially increased trading volume) and stabilization above POC (0.1894) and the middle Bollinger Band.
• Stop Loss: Set below the low point of the breakout candle, for example, 0.1840.
• Target: Upper edge of VAH 0.2071, and the upper Bollinger Band (currently about 0.1984).
• Expected Profit-Loss Ratio: With an entry price of 0.1900, stop loss at 0.1840, and target at 0.2071, the profit-loss ratio is approximately (0.2071-0.1900)/(0.1900-0.1840) = 2.85.
Risk Alerts and Position Management
1. High Leverage Risk: The OI/Market Cap ratio reaches 149.38%, indicating that overall market leverage is extremely high, and any reverse fluctuations could lead to large-scale liquidations, exacerbating price volatility.
2. Momentum Decay Risk: Contract trading volume plummeted by 43.3% during price increases, indicating a lack of buying power, with doubts about the sustainability of the price increase, posing risks of false breakouts or rapid pullbacks.
3. Sentiment Reversal Risk: The negative funding rate and rapid decline in the long-short ratio indicate that although spot prices are rising, short forces in the contract market are accumulating, and caution is needed regarding an instant shift in long and short forces.
Position and Risk Control Recommendations:
• Absolutely avoid high leverage, recommend using low leverage or spot trading.
• Adopt a batch building strategy, especially in the support area of Plan A, and do not fully invest at once.
• It is recommended that total risk exposure does not exceed 1%-2% of the account principal. When contract trading volume continues to shrink or the funding rate is extremely negative (e.g., below -0.01%), positions should be actively reduced or new positions paused, mainly adopting a wait-and-see approach.
Like and follow for real-time updates!
$LUNA2