
The current ICP spot and contract prices are basically flat, and the market is in a weak downward fluctuation pattern. Prices have not only fallen below the MA200 and average holding cost but are also located in the lower half of the Bollinger Bands, indicating that bears dominate. However, the trading volume in the contract market has significantly shrunk, while the pressure from spot buying is notable, suggesting that after a panic sell-off, the short-term downward momentum may weaken, and a technical rebound or consolidation is brewing.
Key prices and range structure
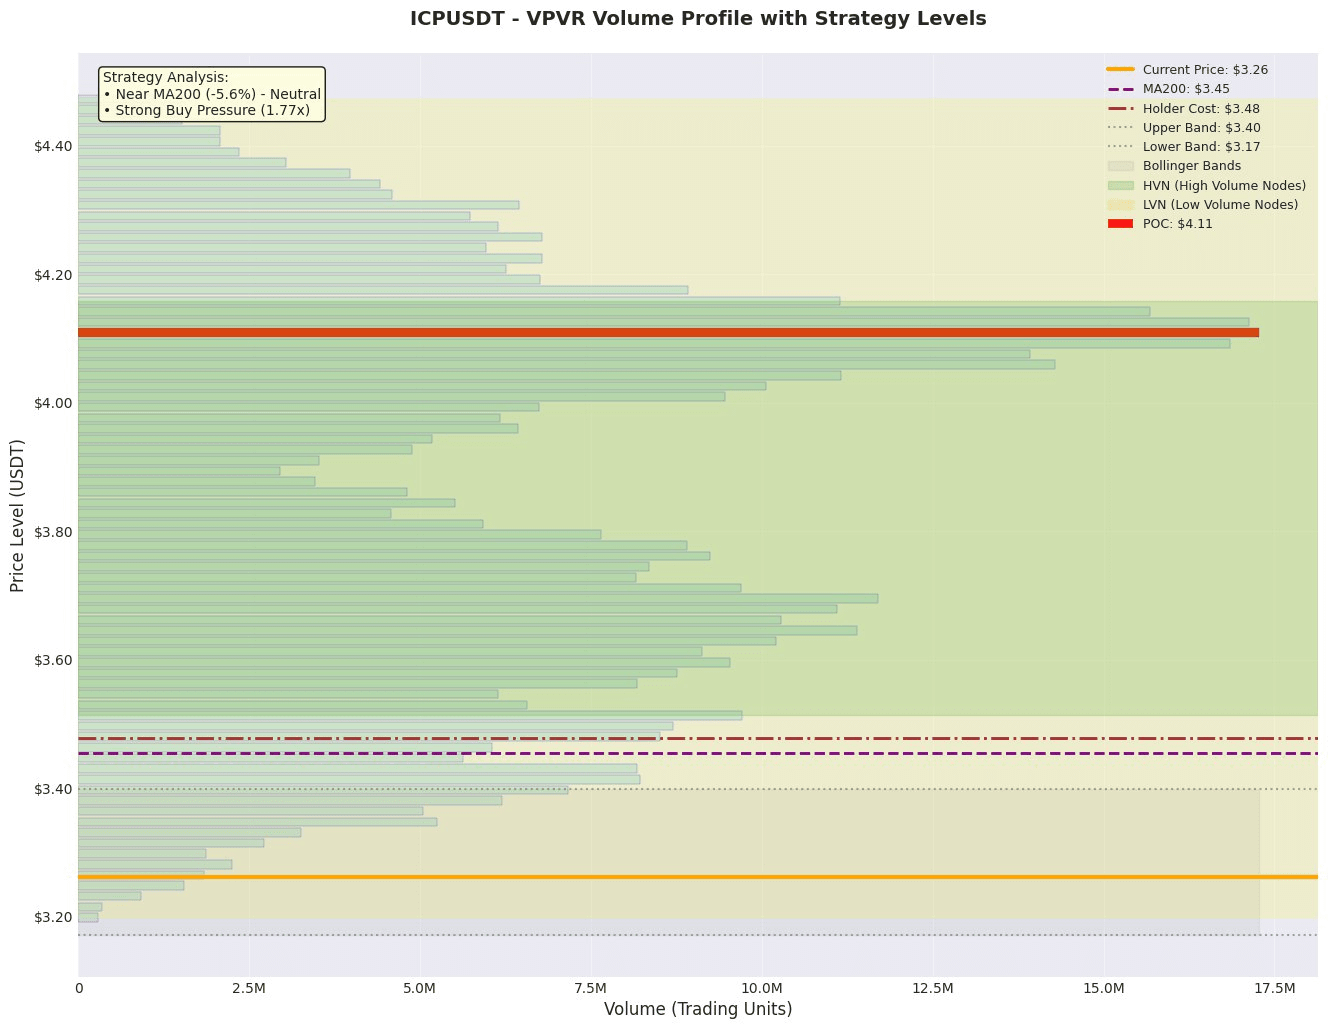
1. Value anchoring area: According to VPVR data, the current price (3.262) is far below the value area (3.397 - 4.308) and POC (4.109). This means that most positions in the market are in a state of loss, and POC (4.109) has become a strong resistance level above. The current price is below the "value area" and is in the oversold zone, but it needs to effectively stand above the lower edge of the value area (3.397) to confirm a return to the value center.
2. Trend and volatility range: The current price (3.262) is about 5.6% lower than the MA200 (3.455), confirming a bearish medium to long-term trend. The price is in the lower position of the Bollinger Band (3.172 - 3.398) (39.9%), with the lower band (3.172) constituting short-term support, and the upper band (3.398) along with MA200 (3.455) and the lower edge of the value area (3.397) forming a dense resistance band.
3. High trading volume/chip concentration area (HVN): VPVR shows that the value area (3.397 - 4.308) is a high trading volume area (HVN). Especially around 3.397-3.398, it is a resonance point of the upper Bollinger Band, lower edge of the value area, and MA200, constituting a very strong first resistance area. Prices rebounding to this level will face huge selling pressure.
Derivatives and liquidity analysis
• Leverage sentiment: The funding rate is slightly negative (-0.0059%), indicating that bearish sentiment slightly dominates the contract market, but extreme bearishness has not occurred. The long-short ratio decreased from 2.38 to 2.28, showing a reduction in long positions, but overall remains bullish, with potential risks of 'bears not dying.'
• Liquidity signal: Contract trading volume plummeted by 33.4%, while open interest (OI) remained stable at 32,570,000, with the OI/market value ratio (1.84%) at a relatively healthy level. This is not a liquidity exhaustion (OI plummeting), but a typical 'decline on reduced volume' pattern, indicating a weakening willingness of the main short forces to suppress, with strong market wait-and-see sentiment.
• Leverage advice: Given that the price is near key support and trading volume is shrinking, market direction is unclear. It is not suitable to amplify leverage. Any trading should reduce position sizes, mainly to test lightly, and wait for a volume signal to confirm direction before considering adjusting positions.
News and event impacts
News summary shows that Coindesk reported 'ICP broke through major support, and trading volume surged confirming the acceleration of the downtrend,' which is clearly bearish sentiment and may have intensified the market's panic selling, resonating with the technical breakdown. Other news mainly revolves around the development of the ICP ecosystem, with sentiment being neutral. The current market has partially digested this bearish news, shifting focus to technical gameplays.
Trading strategy
Plan A: Conservative rebound strategy (light position trial long)
• Direction: Short-term long to bet on a rebound.
• Entry range: 3.172 - 3.200 (support area at the lower Bollinger Band).
• Stop-loss level: 3.120 (breaking below the lower Bollinger Band by about 1.5 times the ATR hypothetical range, or below previous lows).
• Target level: 3.398 (resistance formed by the upper Bollinger Band and the lower edge of the value area).
• Expected risk-reward ratio: (3.398 - 3.186) / (3.186 - 3.120) ≈ 3.21. (Calculation based on entry median 3.186)
Plan B: Aggressive breakout confirmation strategy (right-side shorting or shorting on rebound)
• Direction: Short after rebound is blocked.
• Entry range: 3.390 - 3.410 (strong resistance zone formed by MA200, lower edge of the value area, and the upper Bollinger Band).
• Stop-loss level: 3.455 (above MA200).
• Target level: 3.172 (lower Bollinger Band).
• Expected risk-reward ratio: (3.400 - 3.172) / (3.455 - 3.400) ≈ 4.15. (Calculation based on entry median 3.400)
Risk warning and position management
1. Major risks:
• Liquidity risk: Contract trading volume plummeted by 33.4%, with insufficient market depth, large orders can easily trigger severe price fluctuations, and stop losses may be amplified.
• Trend continuation risk: The price is still below MA200 and holding cost, the overall bearish trend has not changed, and the rebound may only be a continuation of the downtrend.
• Long-short ratio risk: The long-short ratio remains as high as 2.28, if the price further declines, it may trigger concentrated long liquidations (longs killing longs), accelerating the downside.
2. Position and risk control advice:
• Absolute light position: It is recommended that the risk exposure of a single trade does not exceed 1%-2% of the total capital.
• Avoid high leverage: The current environment is not suitable for high leverage (suggested ≤5x), focusing on spot or low-multiple contract operations.
• Gradual entry and wait: Plan A can consider gradually testing light positions near support zones, with strict stop losses. If the price directly breaks down below the 3.172 support with volume, all long plans should be temporarily paused, shifting to wait-and-see. Plan B needs to wait for the price to rebound to the resistance zone and show a clear stagnation candlestick pattern (such as a long upper shadow) before entering.
Like and follow for real-time updates!
$ICP
