
The current market is in a consolidation phase following a panic-driven decline. The spot price is significantly below MA200 and the cost of positions, indicating a weak medium-term trend, but the Bollinger Bands show that the price has reached the lower band, indicating an oversold state. At the same time, trading volume has significantly increased, and buying pressure far exceeds selling pressure, suggesting that bottom-fishing funds have entered amid panic selling, with a potential for a technical rebound in the short term.
Key Price and Range Structure
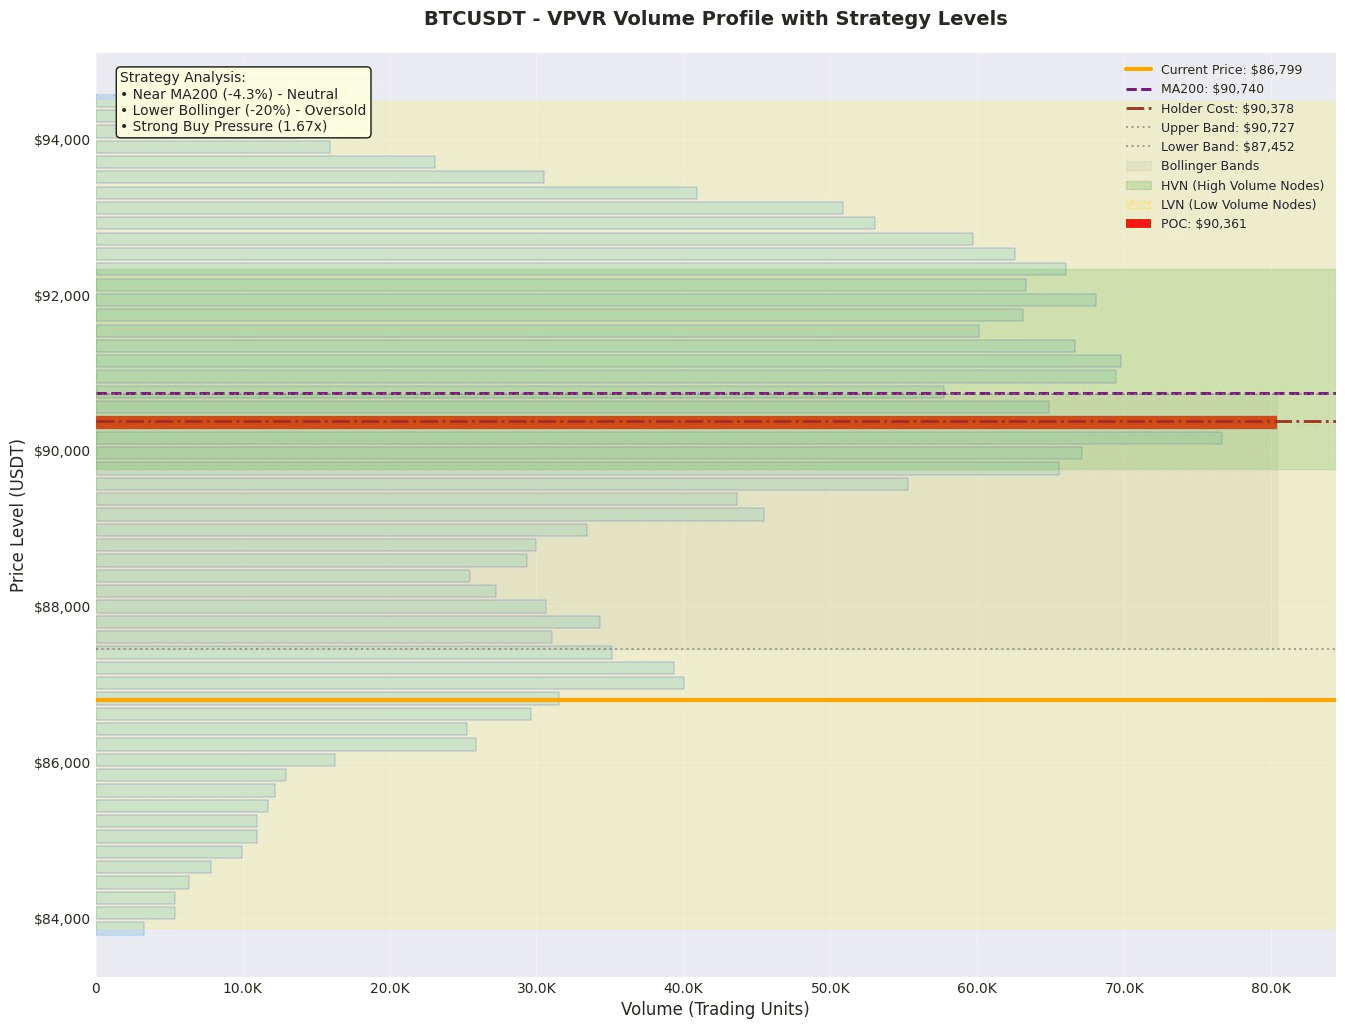
1. Value Anchoring Area: According to VPVR data, the core value range (Value Area) is between 87014 and 93313, with POC (Point of Control) at 90360. The current price of 86799 is at the lower end of this value range, and POC constitutes the primary resistance above. Support or rebound at the lower end of the value range is an initial signal of the market returning to 'fair value'.
2. Trend and Volatility Range: Price (86799) is significantly lower than MA200 (90739) by about 4.3%, confirming a bearish medium to long-term trend. At the same time, the price is near the lower Bollinger Band (87451), with the Bollinger Band range being 87451-90726. This indicates that the price is at an extreme low within the short-term volatility range, technically indicating a demand to revert to the middle band (approximately 89089).
3. High Volume/Concentration Area (HVN): POC (90360) is the most important high-volume resistance area above. In addition, the order book shows concentrated sell walls near 87450 and 87680 (approximately 535K and 526K USDT, respectively), forming immediate short-term resistance. At the same time, there are large buy walls at 86000 and 86500 (approximately 3725K and 1628K USDT, respectively), forming solid support below.
Derivatives and Liquidity Analysis
Contract market data shows that open interest (OI) is as high as 7818.67M USDT, with the funding rate close to zero (0.00002828), and the long-short ratio slightly decreased from 2.2563 to 2.1551. This indicates:
• Leverage Bias: Although the long-short ratio has decreased, the value is still greater than 2, indicating that the overall market leverage is still biased towards bulls, but the congestion has eased.
• Liquidity Condition: The change in contract trading volume is -5.2%, and no sharp decline has occurred; OI remains high, indicating that market liquidity has not dried up, but high OI also means that once the price experiences a reverse fluctuation, it may trigger a violent chain reaction of long and short liquidations.
• Leverage Suggestion: In the current environment of high OI, with prices at critical support and no clear trend reversal, it is not suitable to use high leverage. Trading should focus on low leverage or spot trading, emphasizing the capture of key price points rather than amplifying volatility risk.
News and Event Impact
Currently, there are no significant news events. The provided news summary is only routine information channels, without mentioning specific core events that impact the market, having limited influence on short-term price trends.
Trading Strategy
Plan A: Conservative Bottom Fishing Strategy (Long)
• Direction: Long
• Logic: The price receives support at the lower edge of the value area, the lower Bollinger Band, and a large buy order support area, with significant buying pressure (buy-sell pressure ratio 1.67x), betting on an oversold rebound.
• Entry Range: 86500 - 86800 (based on the large buy walls below and the current price)
• Stop Loss: 85900 (placed below the key buy support at 86000, if broken, support fails)
• Target Levels:
1. First Target: 87680 (breakthrough of major sell orders)
2. Second Target: 89089 (Bollinger Band middle band)
3. Third Target: 90360 (VPVR POC resistance)
• Expected Risk-Reward Ratio: Based on an entry at 86800, stop loss at 85900, first target at 87680, risk 900, potential profit 880, risk-reward ratio approximately 1:0.98. If reaching the second target, the risk-reward ratio can be improved.
Plan B: Aggressive Breakthrough Strategy (Short)
• Direction: Short
• Logic: If the rebound is weak and the price cannot effectively stay above the lower edge of the value area (87014) and the lower Bollinger Band (87451), it may continue to decline and test lower support.
• Entry Range: 87300 - 87500 (when the rebound meets resistance near the lower Bollinger Band and sell walls)
• Stop Loss: 87800 (placed above the major sell orders at 87680)
• Target Levels:
1. First Target: 86500 (upper edge of the large buy wall)
2. Second Target: 86000 (core buy support level)
• Expected Risk-Reward Ratio: Based on an entry at 87400, stop loss at 87800, first target at 86500, risk 400, potential profit 900, risk-reward ratio approximately 1:2.25.
Risk Warning and Position Management
Main Risks:
1. High OI Risk: The extremely high open interest may trigger large-scale forced liquidations once the price fluctuates rapidly, exacerbating market volatility and leading to stop losses being breached.
2. Trend Reversal Risk: The price remains below MA200, and the overall bearish trend has not changed; any rebound may only be a technical correction. If it fails to recover key resistance (such as POC 90360), the trend may continue.
3. Liquidity Sudden Change Risk: Although the current trading volume has not plunged, it is necessary to be alert to a sudden shrinkage in contract trading volume or a shift to extreme negative funding rates, which may signal an acceleration of the trend.
Position and Risk Control Suggestions:
• Gradual Position Building: For bottom fishing strategies, it is recommended to enter in 2-3 batches within the support range to lower the average price and verify the effectiveness of the support.
• Strict Control of Leverage and Position: Total position risk exposure should not exceed 5% of the total account funds. Given the high OI environment, absolutely avoid using high leverage, focusing on spot or low-multiple contracts.
• Dynamic Risk Control: Closely monitor changes in OI and funding rates. If OI decreases significantly during price rebounds (long liquidations), or if the funding rate turns significantly negative, even if stop losses are not triggered, consider reducing positions or standing aside.
Like and follow for real-time updates!
$BTC
