
The current BTC spot and futures market is showing a weak oscillation pattern, with prices having fallen below the key medium to long-term moving average line MA200 and the overall holding cost. Although selling pressure is generally high, the accumulation of buy orders at close range indicates a willingness to bottom out in the short term. The market is in a technical repair stage after the decline and has not yet formed a clear unilateral trend.
Key price and range structure
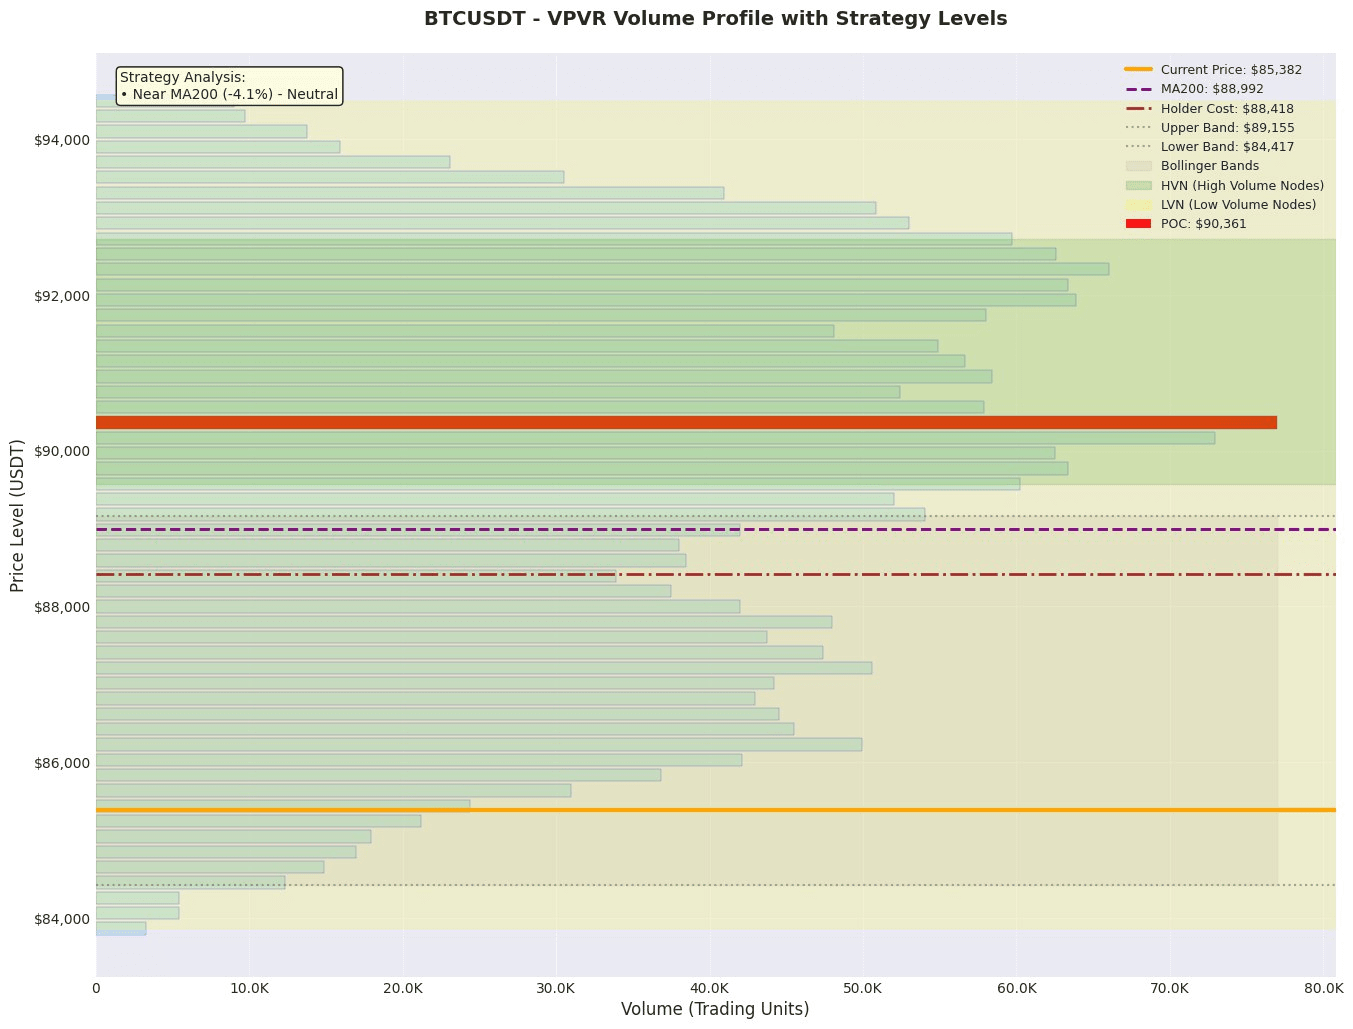
1. Value anchoring area: According to VPVR data, the current market's value anchoring area (Value Area) is between 86226.7058625 and 93117.0919875, with POC (Point of Control) being 90360.9375375. The current price of 85381.89 is below the lower edge of this value area, indicating that the market has entered a short-term oversold region. POC (90360) and MA200 (88992) jointly form a core resistance area above, and a price rebound to this level will face strong selling pressure.
2. Trend and Volatility Range: The price (85381.89) is approximately 4.1% below MA200 (88992.4296), confirming a weak mid-term trend. The Bollinger Band range is from 84417.17336972439 to 89155.24963027562, with the current price near the lower Bollinger Band (20.4% position), suggesting a potential technical oversold rebound in the short term. The lower boundary of 84417 is a key support level.
3. High Trading Volume/Chip Concentration Area (HVN): The Value Area of VPVR (86226-93117) is itself a broad high trading volume area, and prices running within this range will face significant friction. Specifically, there is notable sell order accumulation near 85900.0 and 86090.0 (totaling approximately 8748K USDT), forming a nearby resistance zone. Meanwhile, near 84544.0 and 84100.0, there is significant buy order accumulation (totaling approximately 4938K USDT), serving as a key support zone below.
Derivatives and Liquidity Analysis
Contract market data shows that the 24-hour contract trading volume plummeted by -53.3%, while open interest (OI) remains high at 7673.66M USDT. This indicates that despite a significant decline in trading activity, a large number of leveraged positions have not exited, and the market is in a state of observation and stalemate. The funding rate (0.00006676) is slightly positive, with the long-short ratio rising from 2.2068 to 2.2107, indicating that leveraged funds are still leaning towards long positions, but sentiment is not fervent. High OI combined with shrinking volume is a typical signal of liquidity exhaustion, which can lead to drastic price fluctuations due to sudden events. In this environment, it is not suitable to use high leverage; it is recommended to focus on low leverage or spot strategies and be cautious of slippage risks due to insufficient liquidity.
News and Events Impact
Currently, there are no major news events. The news summaries provided are from regular information platform updates and do not mention specific major news that impacts the market, which has limited influence on current market sentiment and is neutral.
Trading Strategy
Plan One: Conservative Bottom Fishing Plan (Long)
• Direction: Long
• Entry Range: 84500 - 84800 (Bollinger Band lower boundary above 84417, combined with the main buy order accumulation area at 84544)
• Stop Loss: 83800 (If it breaks below the key buy order area at 84100 and the Bollinger Band lower boundary, it confirms a continuation of the decline)
• Target: First target 86200 (Lower edge of VPVR value area), second target 87500 (near the middle of the Bollinger Band and the upper sell order area)
• Expected Profit and Loss Ratio: (86200 - 84650) / (84650 - 83800) ≈ 1.78 : 1
Plan Two: Aggressive Short Selling Plan (Short)
• Direction: Short
• Entry Range: 85900 - 86200 (Main sell order positions at 85900, 86090 and VAL resistance level)
• Stop Loss: 86700 (Effective breakout of VAL and testing POC upwards)
• Target: First target 85000, second target 84400 (Bollinger Band lower boundary)
• Expected Profit and Loss Ratio: (85000 - 86050) / (86050 - 86700) ≈ 1.62 : 1
Risk Warning and Position Management
1. Liquidity Risk: Contract trading volume plummeted by -53.3%, market depth is insufficient, large orders may trigger price flash crashes or spikes, leading to stop-loss failures or significant slippage.
2. Leverage Structure Risk: Open interest remains high, with a long-short ratio still leaning towards long positions. If prices continue to decline, it may trigger a chain liquidation of long leverage, exacerbating the downward trend.
3. Trend Reversal Risk: Prices have fallen below MA200 and cost of holding, and if the rebound is weak, it may confirm a mid-term trend reversal to bearish.
Position Management Suggestions:
• Given the decline in liquidity and unclear trends, it is recommended to adopt a phased building strategy to avoid heavy positions at once.
• Total position risk exposure should be controlled within 1%-2% of total account funds, with strict stop-loss usage.
• In the current environment of abnormally shrinking contract trading volume, high leverage should be avoided (recommended not to exceed 3-5 times). If OI starts to decline sharply or the funding rate shows extreme negative values, actively reduce positions or wait on the sidelines.
Like and follow for real-time updates!
$BTC
