
BCH spot price has strongly broken through the $600 mark, with a 24-hour increase of over 10%. The price is significantly higher than MA200 and the market average holding cost, showing a strong one-sided upward trend. However, technical indicators show that the price has reached the upper Bollinger Band, indicating an overbought risk, and the selling pressure in the spot market is significantly greater than the buying pressure, revealing a cautious sentiment amidst the frenzy.
Key price and range structure
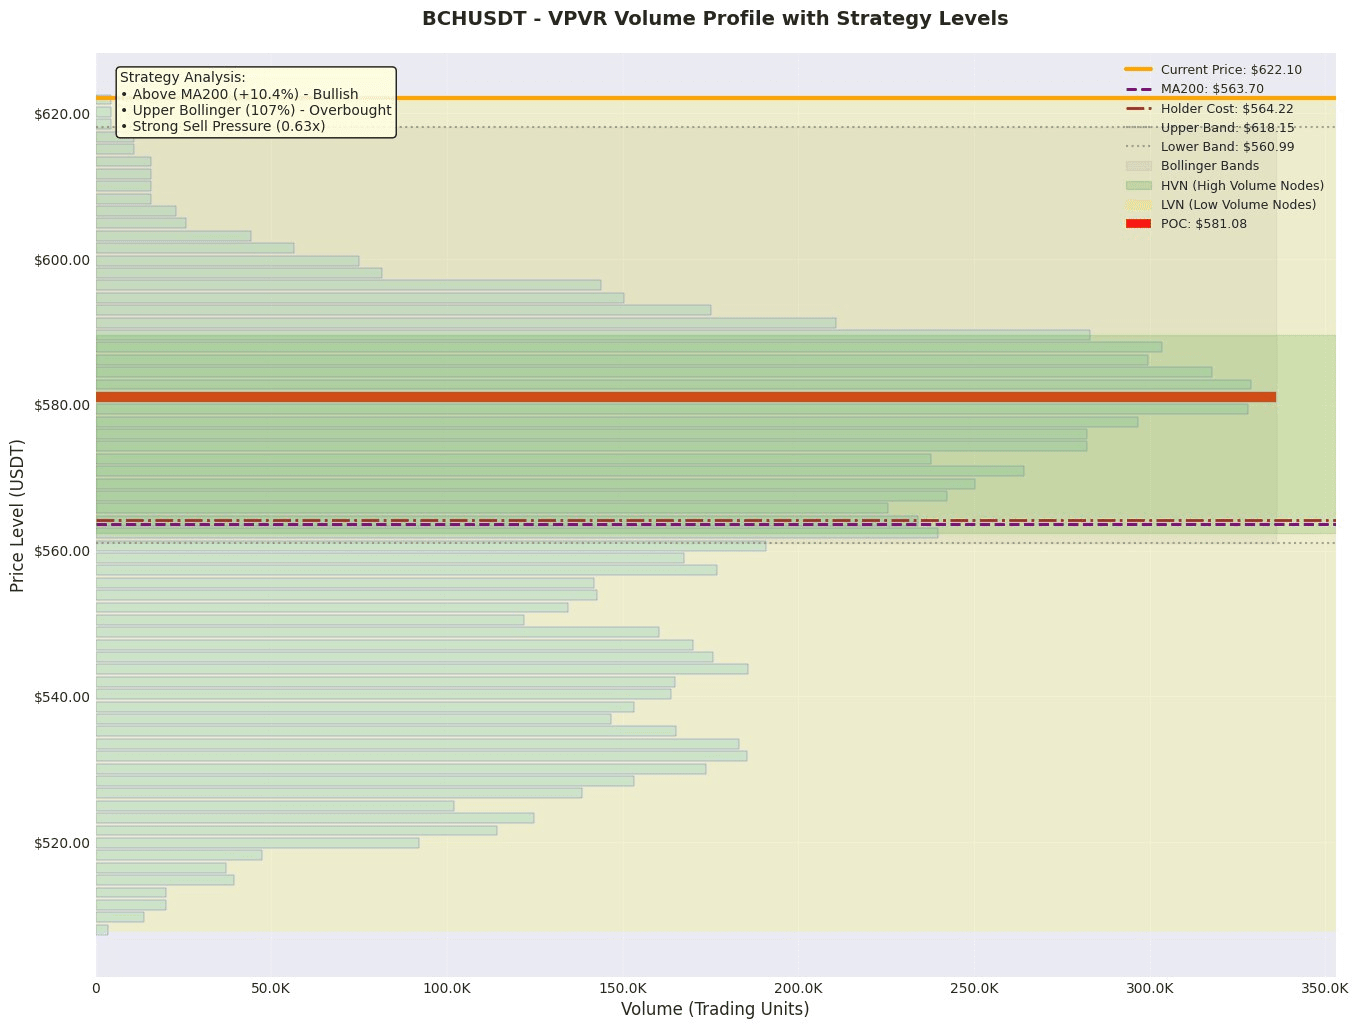
1. Value anchoring area: According to VPVR, the current market value anchor (POC) is at 581.1, and the value range (Value Area) is 530.1-593.0. The current price of 622.1 has run above the upper edge of the value range (VAH), belonging to the overbought area, with a short-term demand for a return to the value center (POC) of 581.1.
2. Trend and Volatility Range: Price (622.1) is far higher than MA200 (563.7), confirming a medium to long-term upward trend. However, the price has broken through the Bollinger Band upper track (618.1) and is at an extreme position of 106.9%, indicating intensified short-term volatility, and upward momentum may exhaust in the short term facing pullback pressure.
3. High Trading Volume/High-Volume Node (HVN): The 581-593 range near the POC is a recent high trading volume concentration area, constituting the most important support zone below the current price. There is a certain low trading volume gap (LVN) between 593 and the current price, which may lead to rapid movement after a breakout, but may also lack support during a pullback.
Derivatives and Liquidity Analysis
• Leverage Fund Bias: Open Interest (OI) is $235.75 million, and the long-short ratio has risen from 1.52 to 1.84, indicating that leveraged funds are significantly biased towards long positions, and the congestion of long positions is rapidly increasing.
• Liquidity Situation: Contract trading volume plummeted by 90.1%, which is a strong signal of liquidity exhaustion. Typically, after a significant rise, a sharp decline in trading volume indicates a lack of new funds, decreased market participation, and price volatility may become more intense and unpredictable due to a lack of liquidity.
• Leverage and Position Recommendations: In an environment of long position congestion and liquidity exhaustion, the market is extremely fragile; any slight disturbance may trigger concentrated long liquidation (stop-loss). Therefore, it is absolutely inappropriate to amplify leverage, and one should significantly reduce positions or remain on the sidelines, waiting for liquidity recovery and market structure reshaping.
News and Events Impact
The current news summary provided is only a platform title index and does not include specific event content; therefore, there is no clear major news event driver to analyze. Market fluctuations are mainly driven by technical and capital factors.
Trading Strategy
Plan A: Aggressive Short Strategy (Betting on Overbought Pullback)
• Direction: Short
• Entry Range: 623-630 (Above current price or in the Bollinger Band upper resistance area)
• Stop Loss Level: 640 (The main sell unit above is too far at 1300, can be set above the entry candlestick high or previous high resistance level)
• Target Level: First target 593 (VAH/support conversion point), second target 581 (POC value anchor)
• Expected Risk-Reward Ratio: Based on entry at 625, stop loss at 640, and target at 590, the risk-reward ratio is approximately (625-590) / (640-625) = 2.33
Plan B: Conservative Long Strategy (Waiting for Trend Pullback)
• Direction: Long
• Entry Range: 590-595 (Value range upper edge overlaps with breakout support)
• Stop Loss Level: 580 (Below POC and HVN)
• Target Level: 618 (Bollinger Band upper track/previous high), looking for breakthrough at 630
• Expected Risk-Reward Ratio: Based on entry at 593, stop loss at 580, and target at 618, the risk-reward ratio is approximately (618-593) / (593-580) = 1.92
Risk Warning and Position Management
1. Main Risks:
• Liquidity Risk: Contract trading volume plummeted by 90.1%, market depth is insufficient, large orders can easily trigger price flash crashes or spikes.
• Long Position Congestion Risk: The long-short ratio rose to 1.84, with market sentiment overly biased towards one side; once reversed, it will trigger severe long liquidation.
• Technical Pullback Risk: Price has broken through the Bollinger Band upper track, and selling pressure has reached 1.58 times, indicating immense short-term overbought pullback pressure.
2. Position and Risk Control Recommendations:
• Absolutely avoid high leverage: Given the aforementioned risks, it is recommended to use extremely low leverage or no leverage.
• Gradual Position Building, Strict Control of Total Position: If choosing to enter, a strategy of small position testing in batches should be adopted, with total risk exposure not exceeding 2%-5% of account capital.
• Actively Avoid Extreme Periods: When liquidity has not recovered and trading volume has not effectively increased, observation should be the main strategy. If a position is already held, consider actively reducing positions or taking profits when the price rises sharply but trading volume is insufficient.
Like and follow for real-time updates!
$BCH
