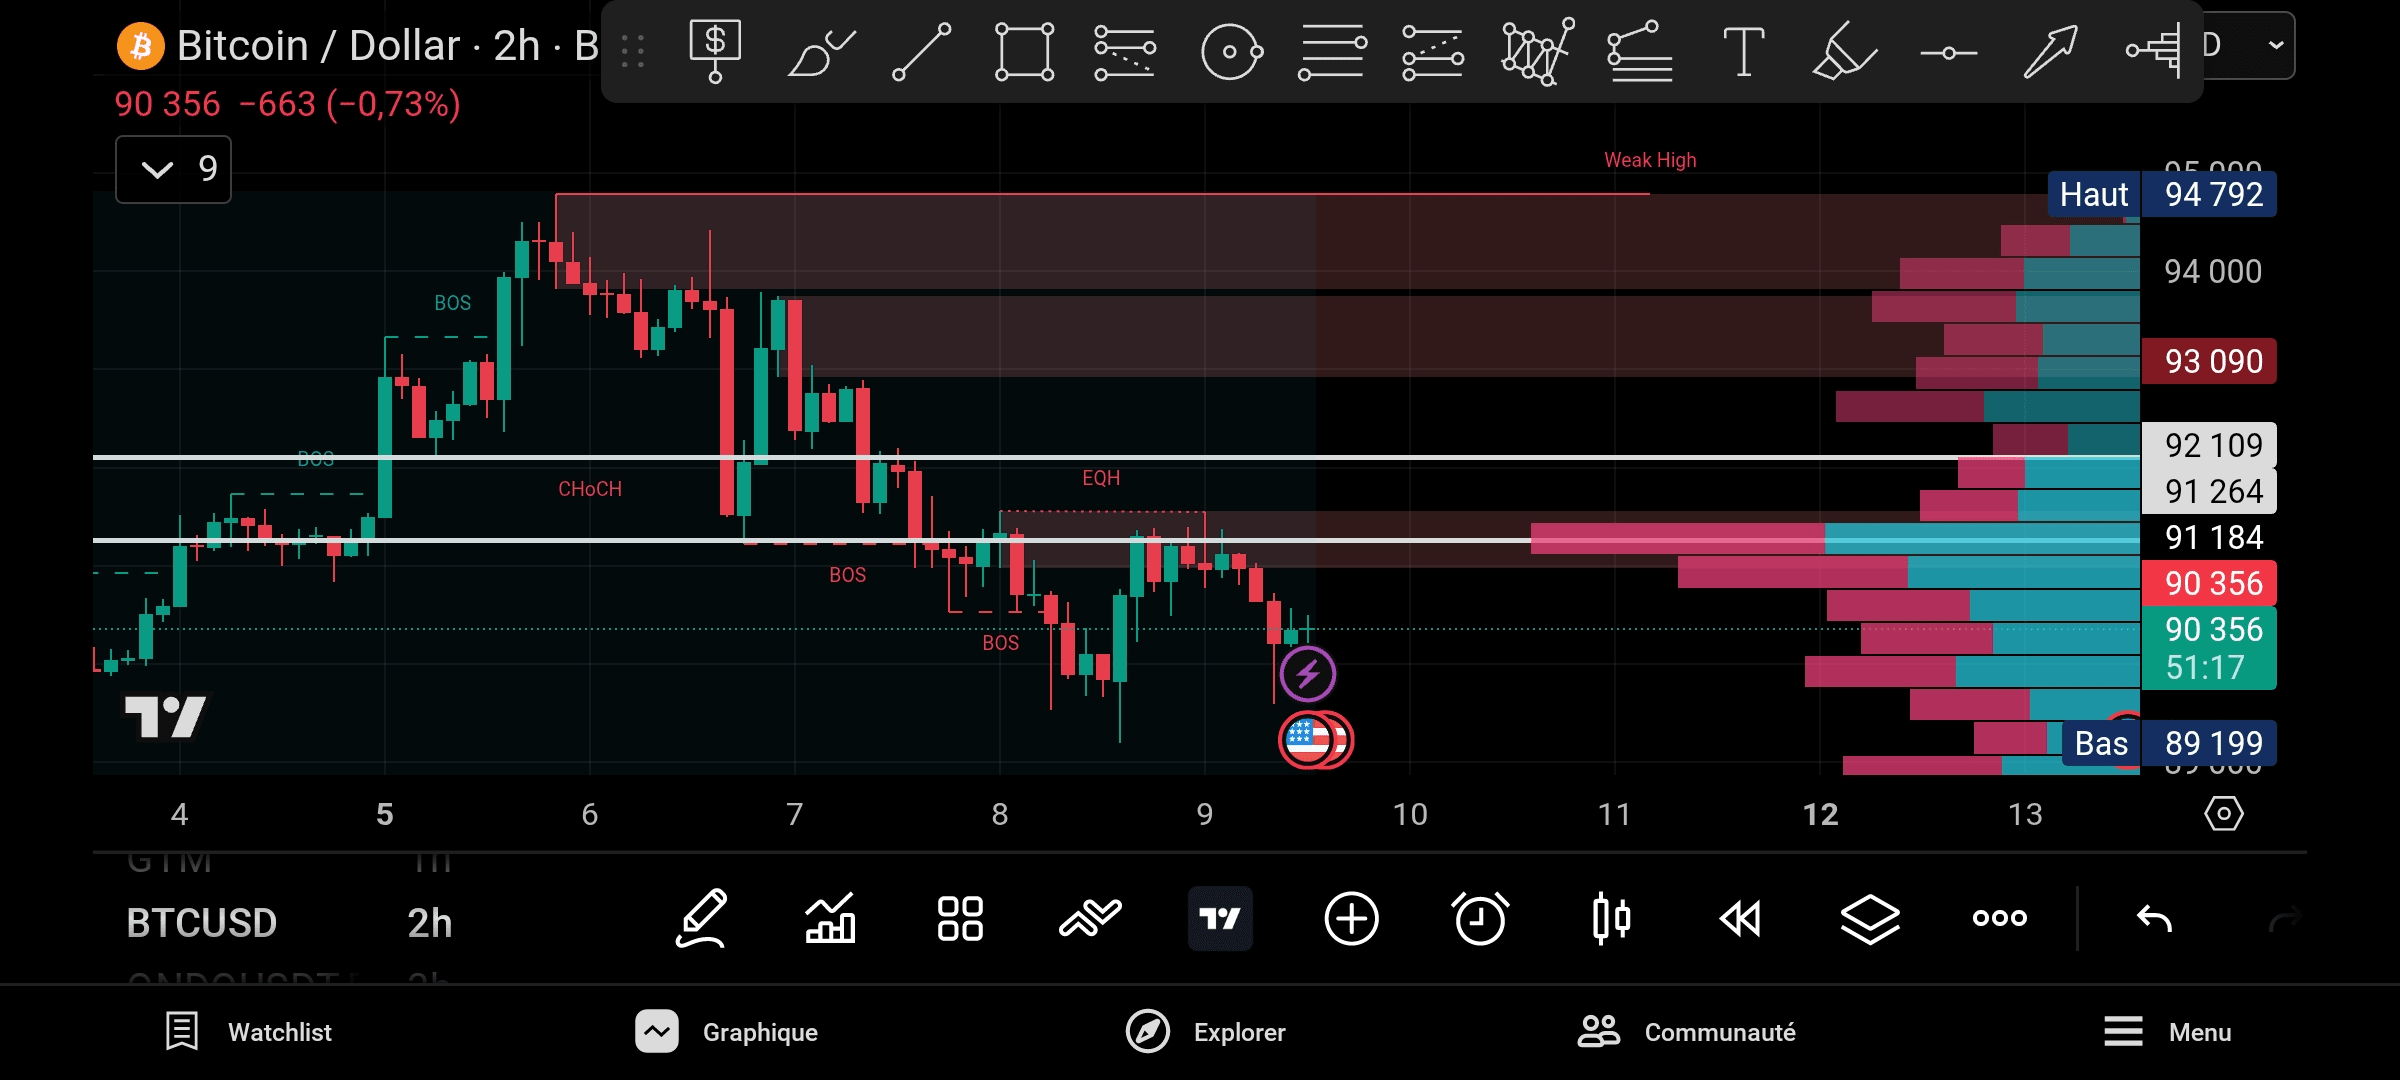
📌 First: Explanation of the notes written on the chart
🔹 BOS (Break Of Structure)
Means breaking the structure.
On the chart you have:
BOS occurred ➜ the market was in an uptrend.
After the downtrend BOS occurred ➜ confirmation of the start of a downtrend.
➡️ Now the overall trend on 2H is downtrend.
🔹 CHoCH (Change of Character)
The market behavior has changed.
Here CHoCH came from uptrend to downtrend. ➡️ This is the first sign that the rise has ended and correction/downtrend has begun.
🔹 EQH (Equal Highs)
Equal highs ➜ Above average liquidity.
Market wants to gather liquidity but failed to break through and reverse. ➡️ Sign of weakness at buyers.
🔹 Weak High
Weak high.
Any price retracement to the support zone = Selling opportunity, not buying.
🔹 Volume Profile (Right side of chart)
🔴 Red = Strong Sell
🔵 Blue = Buy
Largest accumulation now around:
91,200 – 91,300 ➡️ Current equilibrium/resistance zone.
🔹 High / Low
High = 94,792
Low = 89,199 ➡️ Market is currently trading within the range, but the trend is downward.
📉 Second: What is happening now?
Price is currently around 90,356
Last move = Downtrend + weak correction
No BOS emerged, no CHoCH emerged
➡️ Meaning:
❌ No buying confirmation
✅ Selling remains the strongest scenario
🔮 Third: What might drive the market next? (Scenarios)
🟥 Scenario 1 (Closest) – Continued Downtrend
If:
Price failed to return above 91,200 – 91,300
Bearish rejection candle (above)
➡️ Targets:
🎯 89,800
🎯 89,200 (Low)
🟨 Scenario 2 – Correction before the Downtrend
Could move slightly up to:
91,200
Or even 92,100
⚠️ However:
As long as below 92,100 ➡️ Any rally = Pullback for selling, not buying.
🟩 When do we say the trend has changed?
Unless:
2H close above 92,100
And after BOS emerged
➡️ Only here we consider buying.
✅ Quick Summary
📉 Trend: Downtrend
🧠 Market is gathering liquidity
❌ Buying is risky right now
✅ Selling from resistance is optimal
⏳ Wait patiently for confirmation
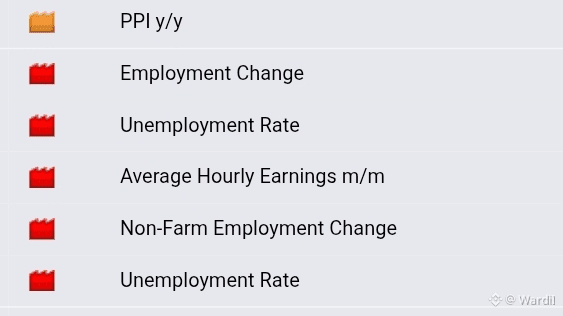
Watch the news now