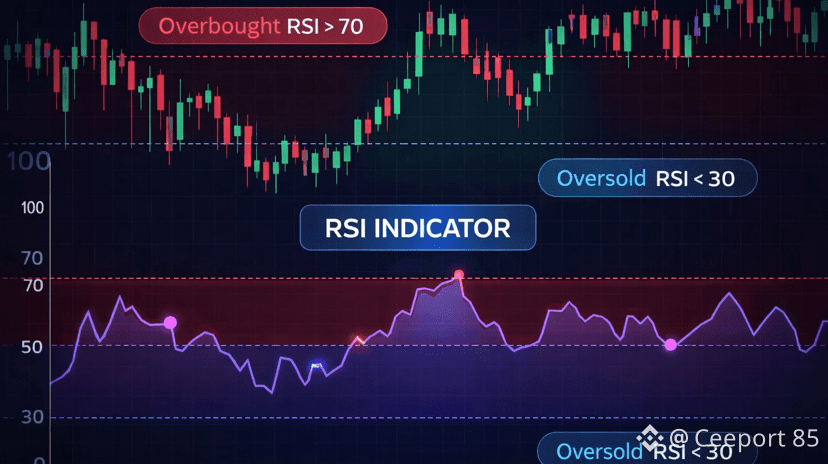
RSI is one of the most widely used and, at the same time, most misunderstood indicators in trading. Most people have been taught that when RSI goes above 70, the market is overbought and therefore "must drop," and when it falls below 30, it is oversold and therefore "must rise." This simple and reassuring idea is also one of the main reasons why many traders systematically lose money.
The truth is that RSI does not measure whether a price is too high or too low. It is not a value indicator and not an automatic reversal signal. RSI measures the strength and speed of movement, that is, how much one direction is dominating the other over a certain period. A high RSI does not mean the price has gone "too high," it means the market is pushing strongly. And that's exactly why in strong trends, RSI can remain above 70, above 80, or even above 90 for hours or days while the price continues to rise without stopping.
Just because RSI is high means deliberately positioning yourself against the dominant market force. It’s a structural error, not bad luck. Similarly, buying just because RSI is below 30 doesn’t mean buying at a discount, but often means entering against a still-developing bearish acceleration. In serious downtrends, RSI remains trapped in oversold territory while price continues to fall, and those who buy 'because it’s oversold' simply become liquidity.
The issue isn’t RSI itself, but the wrong expectations placed on it. Many use it as if it predicts price, when in reality RSI reacts to price. It always comes after. It tells you what’s happening now, not what will happen next. In practice, RSI reveals who is winning the battle at that moment: buyers or sellers. Using it to bet against the current winner is irrational, even if disguised as 'technical analysis'.
There’s a reason market makers love this retail approach. They perfectly know that many traders short when they see a high RSI and buy when they see a low RSI. As a result, they keep the price strong longer than expected, hold RSI in overbought territory, and continue rising until shorts are squeezed. The same happens on the downside, with RSI crushed in oversold territory while price keeps falling. When misused, RSI becomes a trapping tool, not a protective one.
RSI only makes sense when it stops being the main character and becomes a simple filter. It can help determine whether the market is in momentum or compression, whether strength is accelerating or exhausting, but it cannot and should not be the trade trigger. Even famous divergences, often mythologized, are not automatic entry signals. A divergence without context, without levels, without structure, is just incomplete information. It can persist for a long time before price reacts—and often doesn’t react at all.
In the correct use of RSI, a high RSI in an uptrend is not a short signal, but a confirmation of strength. An RSI dropping from 70 toward 40–50 without breaking support levels is often a healthy behavior, not a sign of weakness. Conversely, an RSI remaining low while price continues to make higher lows may indicate silent accumulation, not weakness.
The hard truth is that RSI is not a shortcut, not a traffic light, and not a oracle. It does not predict reversals and does not protect those without a plan. It only helps read momentum, not decide when to buy or sell. Price decides, levels decide, structure decides. RSI, when used properly, accompanies. When used poorly, it condemns.
Whoever understands this stops wondering whether RSI is too high or too low and starts asking a much more important question: who is in control of the market right now, and am I on their side or against them? That’s where the difference lies between those who survive and those who become liquidity.