If we look at the movement $XPL right now, to be honest, this is not the type of chart that makes traders jump in immediately. But it is precisely in conditions like this that many experienced traders usually start to pay closer attention. XPL is currently in a phase often referred to as the decision zone, where the market is determining whether to continue its decline or start building a new base.
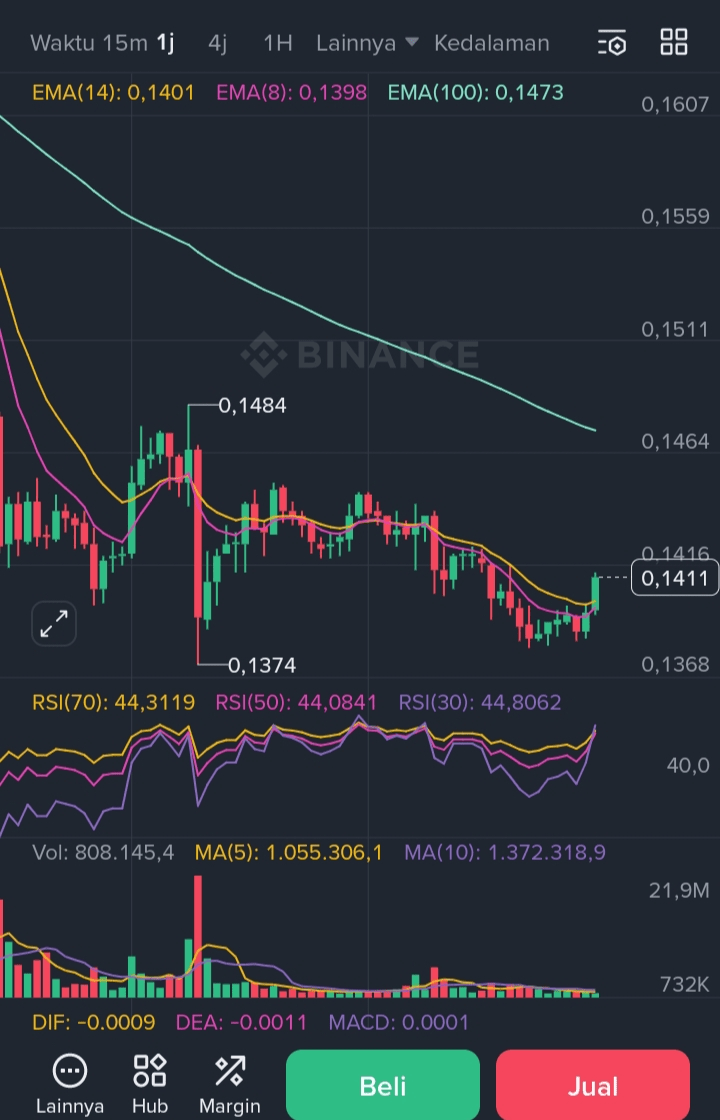
From a technical perspective, XPL's price is still moving below the large EMA, indicating that the major trend has not fully recovered. However, interestingly, selling pressure is starting to weaken. Price movement tends to be sideways with an increasingly narrow range, volume is decreasing, and there are no longer any large sell impulses like before. This pattern often appears when the market begins to enter a slow accumulation phase, especially when most market participants have lost interest due to prices not moving aggressively.
The short-term EMA is being tested by the price, giving an early signal that buyers are slowly trying to take control, although still very cautiously. The RSI is also in the neutral area, neither overbought nor oversold, which means there is still room for movement in both directions. This indicates that the market is waiting for a catalyst or further confirmation before choosing a clearer direction.
For many traders, XPL is currently not about seeking quick profits, but rather about risk management and patience. Aggressive entries without confirmation are certainly risky, but completely ignoring them could also lead to regret if the price suddenly reclaims important levels. A more sensible strategy is to monitor price reactions to the nearest resistance and see if volume starts to support upward movement.
In conclusion, @Plasma XPL is currently in a crucial phase. Not bullish, but also not as bad as it seems. In such conditions, the market usually gives signals first to traders who patiently read the structure, not to those who are just chasing green candles.