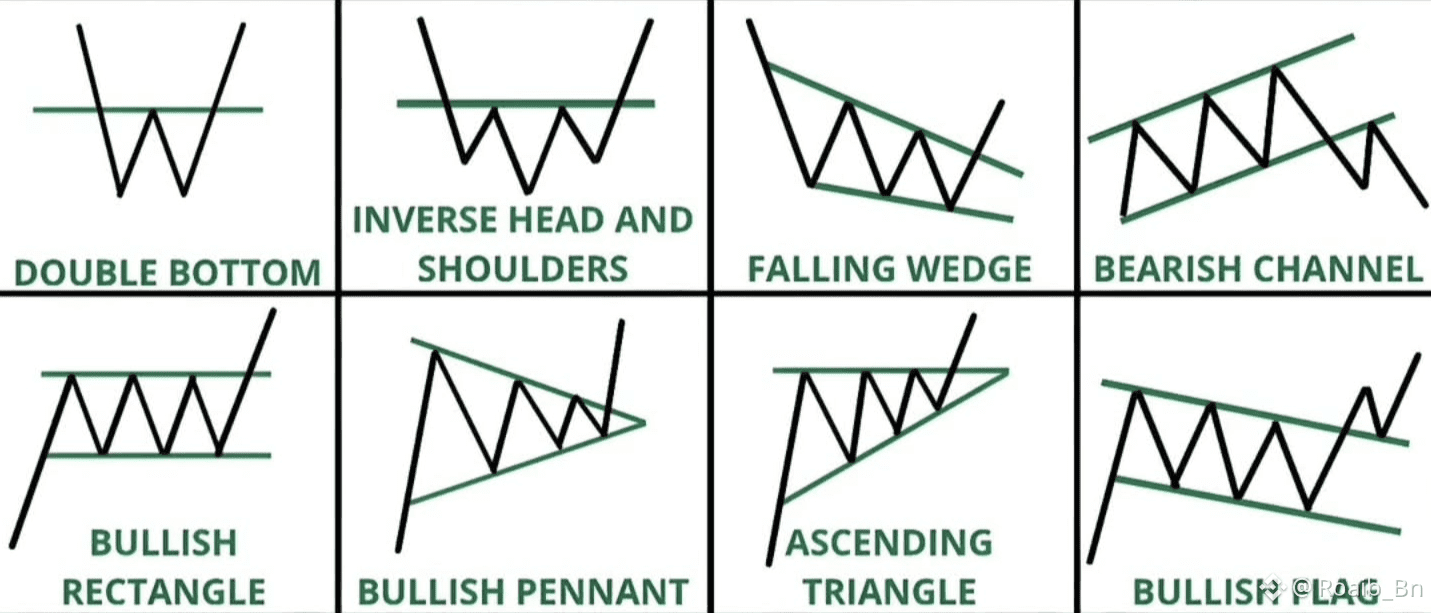
Double Bottom
The double bottom forms after a downtrend and signals a potential trend reversal. Price tests a support level twice and fails to break lower, showing that selling pressure is weakening.
Inverse Head and Shoulders
This is a classic bullish reversal pattern that appears after a decline. It consists of three lows, with the middle low being the deepest, indicating a gradual shift from sellers to buyers.
Falling Wedge
A falling wedge forms when price moves downward within converging trendlines. Despite the falling price, decreasing momentum often leads to a bullish breakout.
Bearish Channel
This pattern shows price moving between two downward-sloping parallel lines. It reflects a controlled downtrend where sellers dominate until a breakout occurs.
Bullish Rectangle
A bullish rectangle appears when price consolidates between strong support and resistance levels. The pattern usually resolves with an upside breakout, continuing the prior uptrend.
Bullish Pennant
The bullish pennant forms after a strong upward move, followed by a brief consolidation. It represents a pause before the price continues higher with renewed momentum.
Ascending Triangle
This pattern is identified by a flat resistance line and rising support. It shows buyers becoming more aggressive and often results in a bullish breakout.
Bullish Flag
A bullish flag occurs after a sharp price rise and a short downward consolidation. It indicates temporary profit-taking before the trend resumes upward.
Here is the patterns image 👇
If you found this helpful then please follow like and comment on it thanks ❤️
#MarketRebound #BTC100kNext? #USJobsData #StrategyBTCPurchase #BTCVSGOLD