Alright, this is a technical analysis for the JF/BNB pair based on the chart (1D frame):
🔍 General Situation
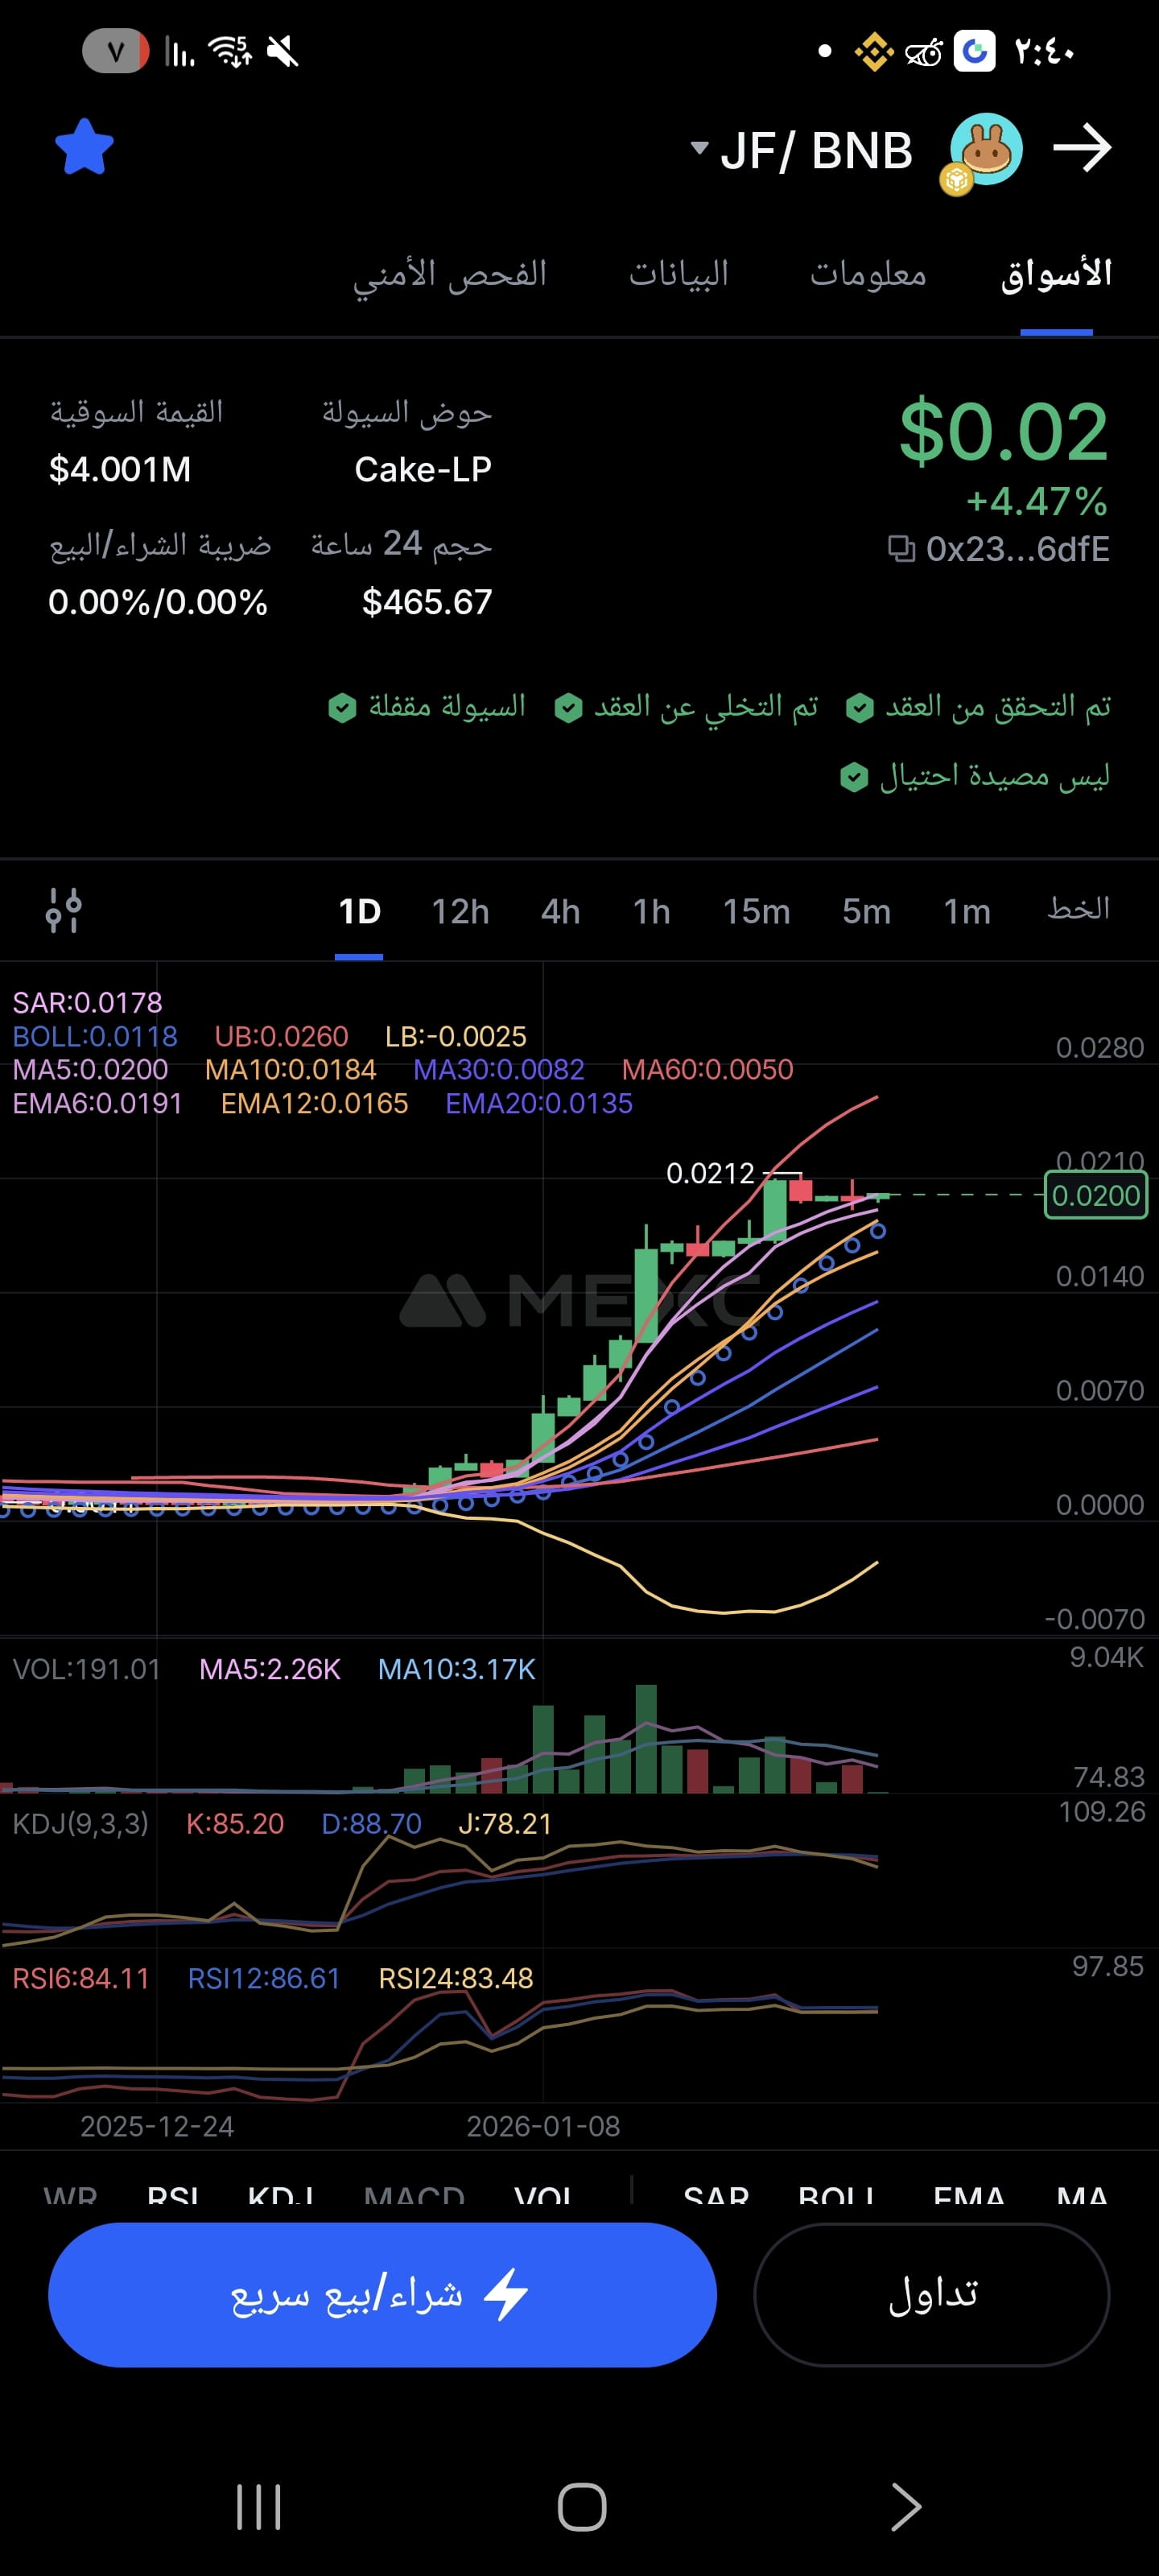
Trend: Strong and clear bullish (Higher Highs & Higher Lows)
The current price is around 0.0200
The last recorded peak: 0.0212
📈 Technical Indicators
🔹 Moving Averages (MA & EMA)
The price is above all moving averages (MA50 / MA100 / MA200)
Clear positive divergence → Healthy upward momentum
Fast EMA still above slow → trend has not broken
🔹 Bollinger Bands
Price is close to the upper limit
Indicates strength, but with the possibility of calming or short sideways fluctuations
🔹 RSI
RSI (6 / 12 / 24) all above 80
⚠️ Clear buying saturation
Does not mean direct drop, but potential correction or accumulation
🔹 KDJ
Very high levels
Any negative crossover will be a short correction signal
🔹 Volume
Good trading volumes during the rise
Slight pullback currently → normal after a strong wave
🧱 Supports and resistances
✅ Supports:
0.0185 first support (short EMA / MA)
0.0165 – 0.0170 very strong support (retest area)
🚧 Resistances:
0.0212 (previous high)
Sustained breakout → Target:
0.024
0.026 (upper Bollinger band)
🎯 Expected scenarios
🟢 Positive scenario (strongest):
Consolidation above 0.019
Break 0.0212 with daily close
Continuation of the upward wave 🚀
🟡 Healthy scenario:
Slight correction / fluctuation between 0.0185 – 0.0205
Then continue rising (better for entry)
🔴 Negative scenario (currently weak):
Break 0.0165
Weakening trend (unlikely now)
🧠 Summary
JF is still very strong
Trend is upward
No real reversal signals
Only buying saturation → potential temporary relief
Any drop = smart buying opportunity, not fear