
The candlestick is used to understand trading patterns. A pattern refers to a specific type of event that gives particular signals, and it is called a pattern. Technical analysts make their trades based on the patterns. In any pattern, two or more candles are arranged in a specific way. However, sometimes a single candlestick can also convey a pattern. Therefore, candlestick patterns can be divided into single candlestick patterns, which involve one candlestick, and multiple candlestick patterns, which involve several candlesticks.
A candlestick pattern shows the high, low, close, and open price of a day, giving you all the information in a single candle. When the market opens, an open price is recorded in that day's candle for any company. Then, as the price goes highest, that price is recorded. After that, when the price goes lowest and closes, that price is recorded. This way, we get all the information about what happened in the market in a single day, but the market does not behave the same every day, so various different patterns of candles keep forming every day.

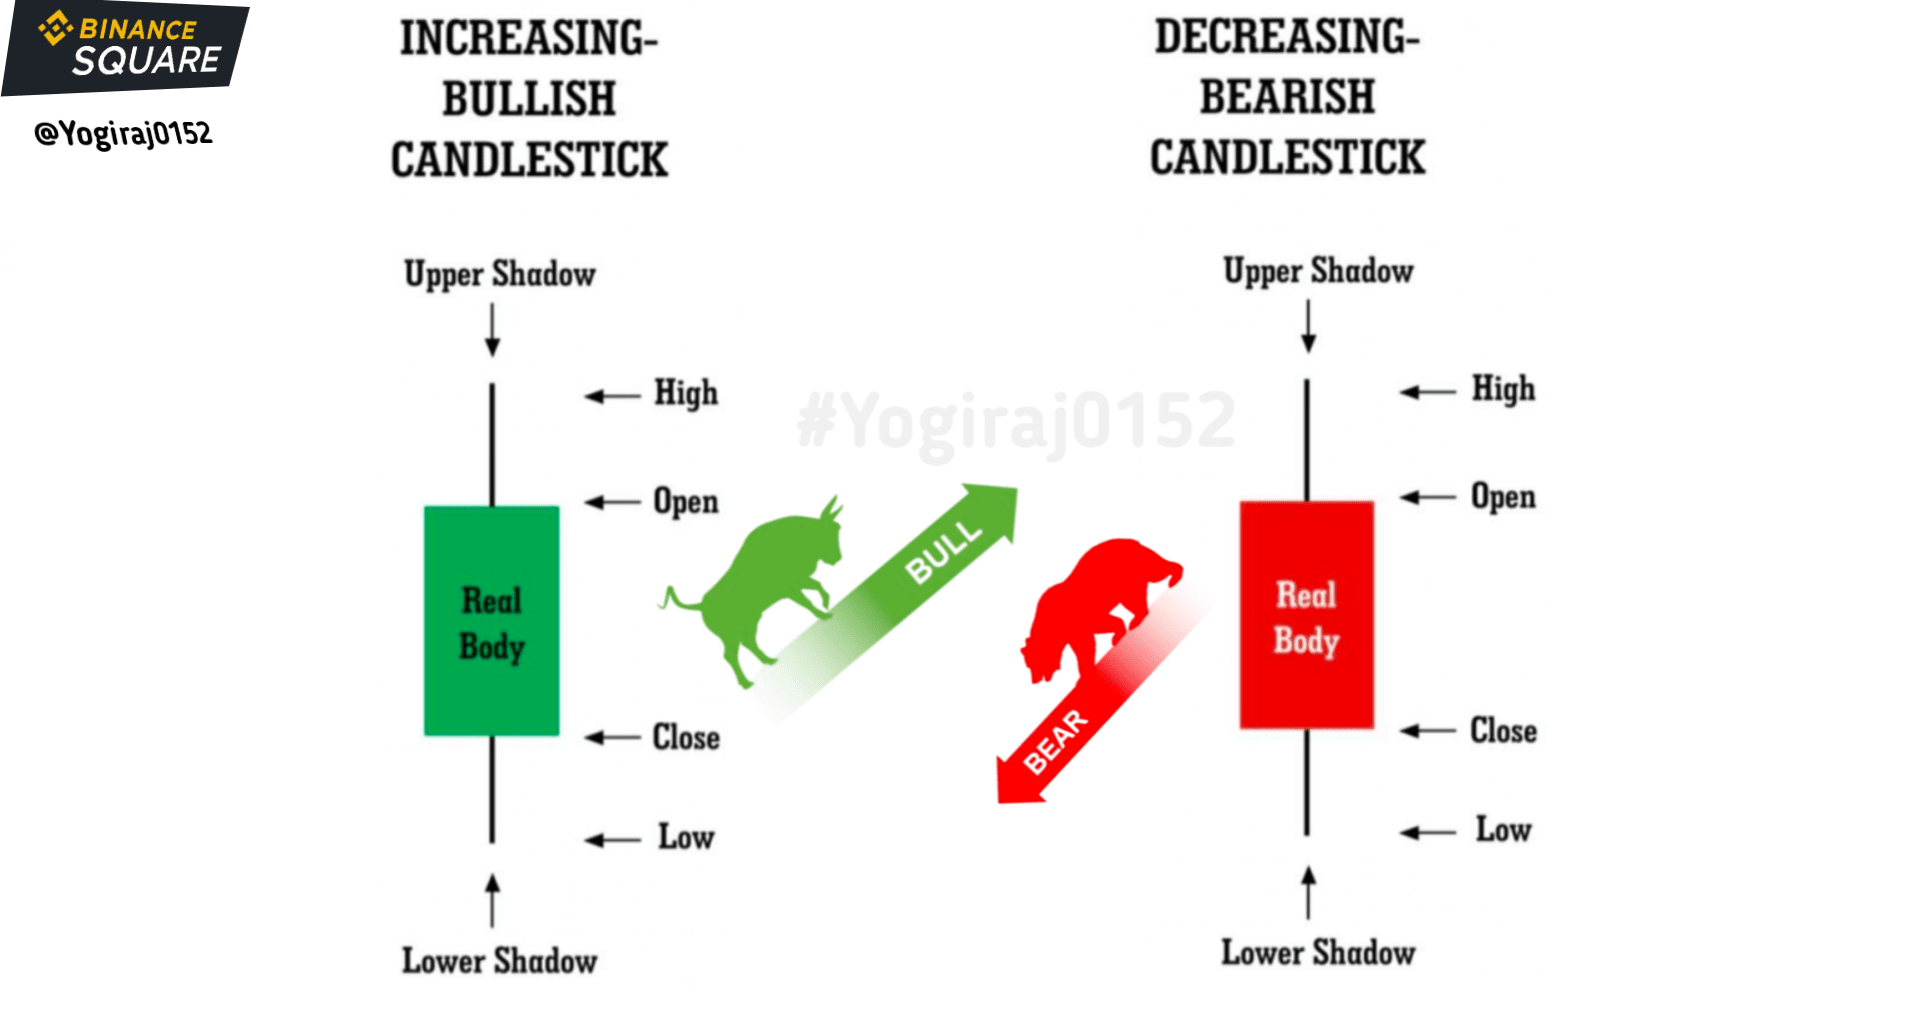
If you understand this base of candlestick, then mainly two types of candles are formed. The first is a bullish candle represented by the green color, where the price is shown in four ways, which we have discussed above.
The second bearish candle is represented by the red color. It also has four types of prices such as open, high, low, and close prices. However, a green candle (bullish candle) means that on that day, the candle closed above its previous close price, and a red candle (bearish candle) means that on that day, it closed below the previous candle's close price.


#CandlestickPatterns #CandlestickAnalysis #Write2Earn #Yogiraj0152