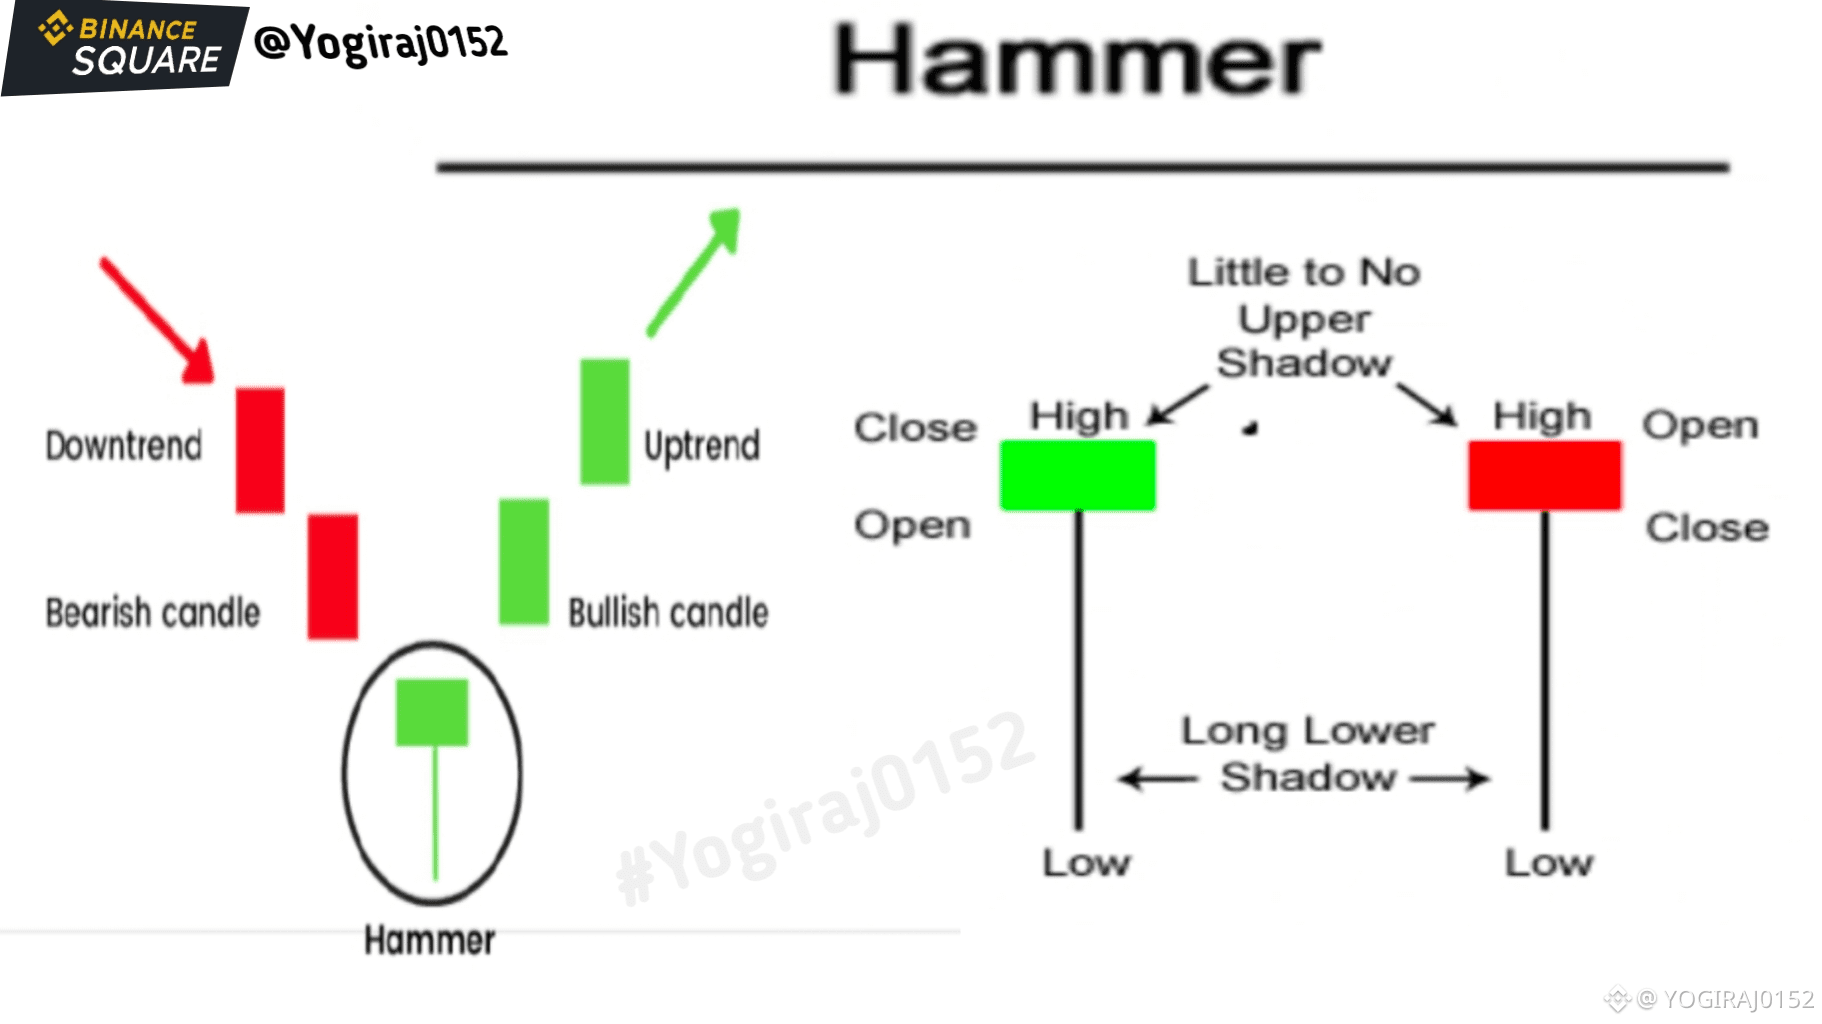

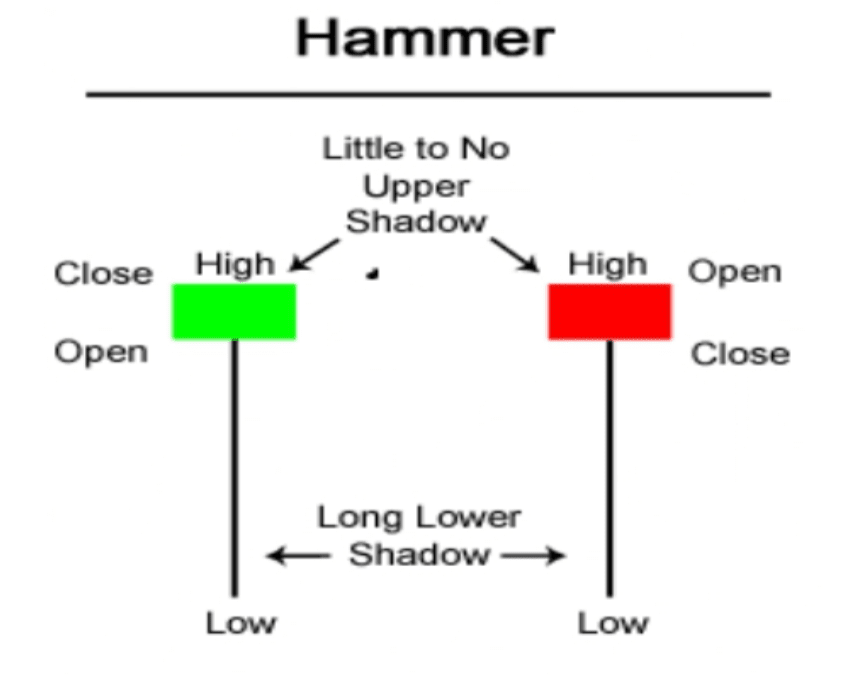
👉 Hammer Type candlestick pattern & Analysis
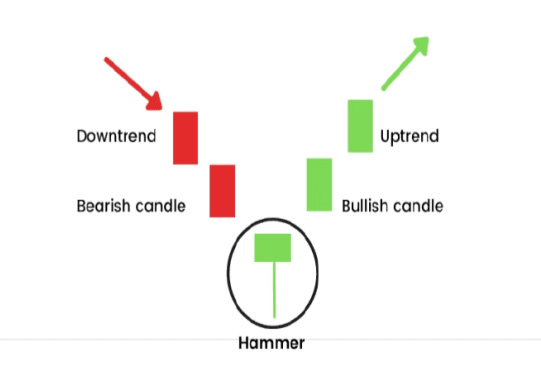
In a Hammer candle, the body of the candle is small and the lower shadow is quite long, while there is no upper shadow at all; this is what we call a hammer candle. This type of candle can be either red or green. If a hammer candle forms in a downtrend on the chart, there is a 90% chance that the market will go into an uptrend, during which the price of the share increases. Conversely, if a hammer candle forms in an uptrend on the chart, there is a 90% chance that the market will go into a downtrend. This hammer works in both day and short-term scenarios, such as 1 minute, 3 minutes, 5 minutes, 15 minutes, 30 minutes, 1 hour, 2 hours, 4 hours, 6 hours, 8 hours, 12 hours, 1 day's, 3 day's, week's & month's; it works in all these charts.
If you liked the post, please like and share it. If you want to say something related to the post, please comment, and we will definitely reply. Follow us so that all our upcoming articles, posts, and videos can reach you.
If you found some good information from our post, you can also give us tips.
Thank you for reading the post!🙏


#hammer #CandlestickPatterns #CandlestickAnalysis #Write2Earn #Yogiraj0152