Key Levels to Watch (Support & Resistance)
🔹 Support Levels:
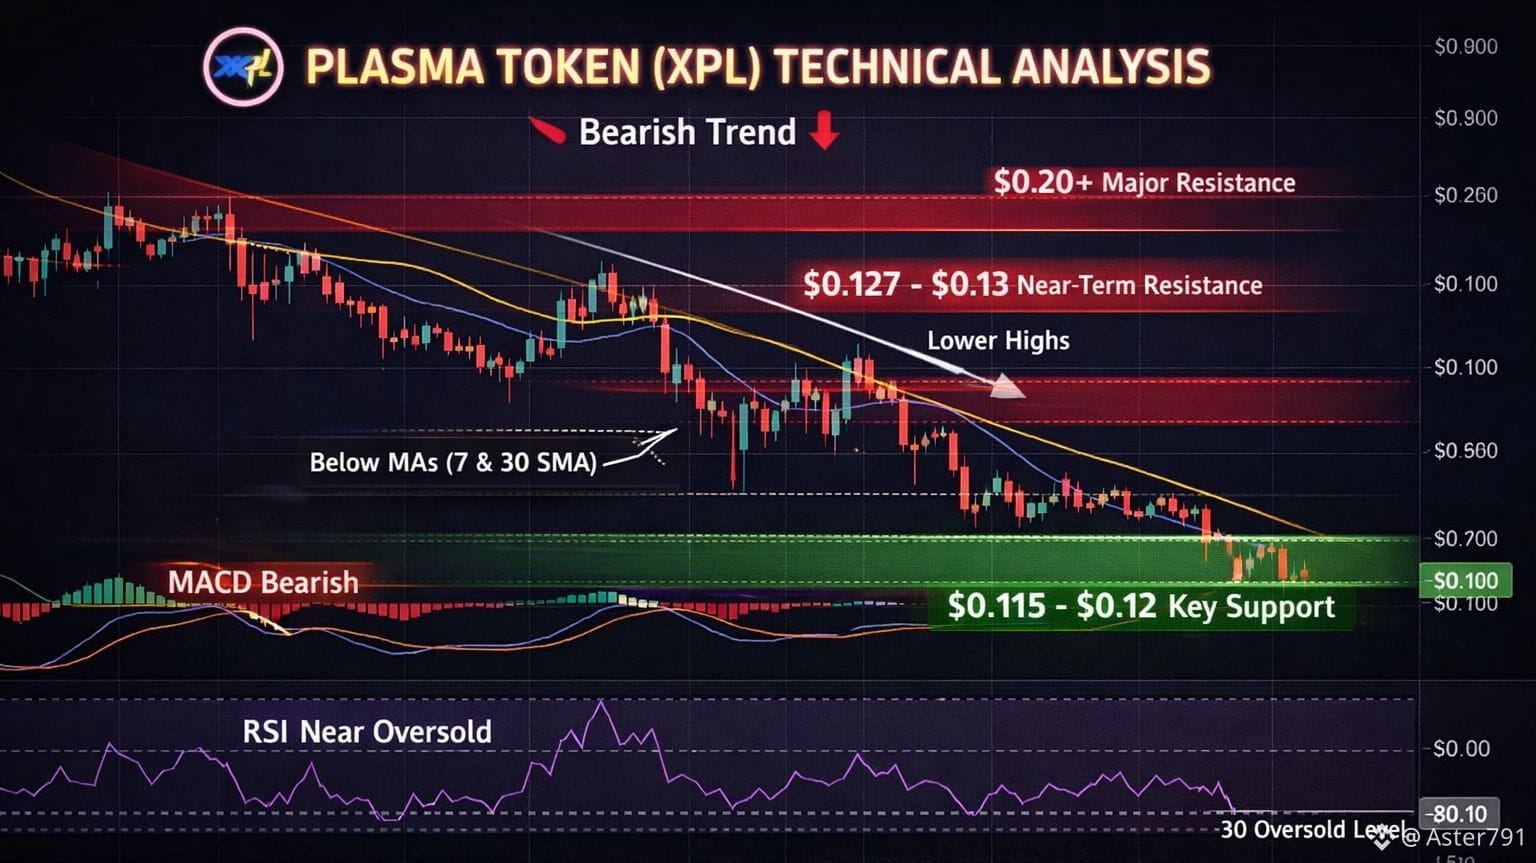
~$0.115–$0.12 — recent swing lows and historical all-time low region. A break below this could mean acceleration of the downtrend. �
CoinGecko
~$0.10 — psychological round number and deeper support if sellers intensify.
🔹 Resistance Levels:
~$0.127–$0.13 — short-term pivot and near current moving average resistance. A close above this could signal short-term relief.
CoinMarketCap
~$0.15–$0.16 — stronger resistance zone containing the 30-day SMA and prior short rallies.
~$0.20+ — psychological and structural resistance; break above this still looks distant.
📌 Indicators Explained
📍 Relative Strength Index (RSI)
RSI ~38 (low momentum): suggests bearish to neutral sentiment but leaving room for possible oversold bounce. Sustained weaker RSI reinforces bearish pressure.
CoinMarketCap
📍 Moving Averages
Price below short and medium moving averages = trend still down.
To flip trend, price needs to cross above 7-day and hold above 30-day SMA.
📍 MACD (Moving Average Convergence Divergence)
Negative MACD histogram = bearish momentum persists. A bullish signal requires a MACD crossover (signal line crossing above MACD line).
📈 Short-Term Scenarios
✔ Bullish Scenario (Relief Rally)
Bounce from immediate support (~$0.12)
Break above $0.127–$0.13 and hold
Rising volume confirming breakout
➡ Above these triggers could draw short-term buyers to test $0.15–$0.16 resistance.
✖ Bearish Continuation
Hold below $0.127 with declining volume
Break under $0.115 support
➡ Could accelerate decline toward deeper supports and extend downtrend.
🧠 Sentiment & Catalysts — Chart Impact
Fundamental catalysts like cross-chain integrations (e.g., NEAR Intents integration) have helped short relief rallies — but technical structure remains corrective until renewed strong demand appears. �
CoinMarketCap
Additionally, continuous token unlocks and supply pressure can weigh on price by increasing sell side pressure, which typically influences bearish chart formations.
🛠 Trader Tools & Patterns
Common tools technical analysts use on XPL include:
Trendlines (to track downtrend slope)
Support/Resistance zones
Moving averages crossovers (e.g., golden/death crosses)
Bollinger Bands (to gauge volatility)
Volume confirmation (to validate breakouts) �
MEXC
Note: Patterns like descending channels or consolidation ranges can inform where bounce or breakdown happens next.
🧩 Summary
Aspect
Status
Trend
Bearish overall
Momentum
Weak (RSI/MACD downside)
Key Support
~$0.115–$0.12
Key Resistance
~$0.127–$0.15
