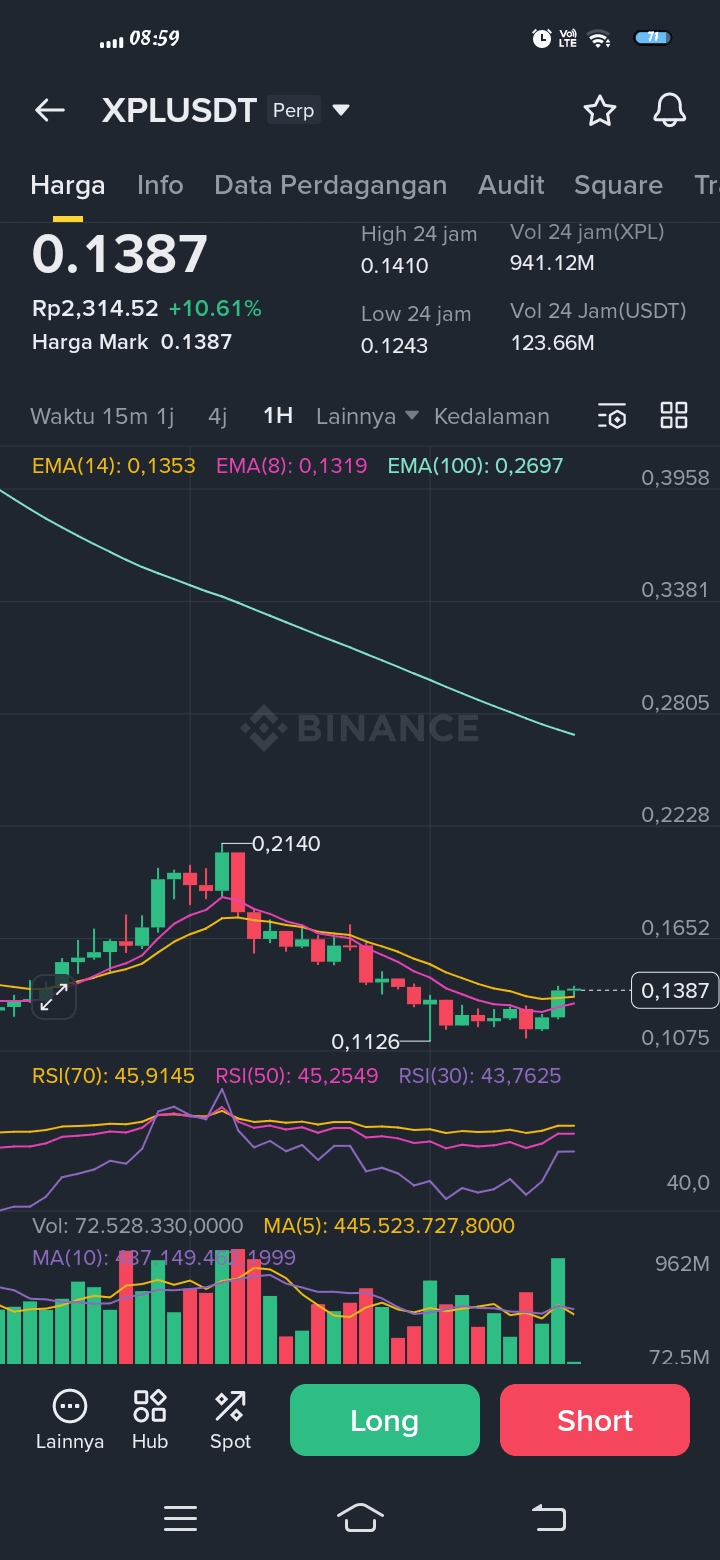
Technically, $XPL finally shows signs of structural change on the 1-Day timeframe. After a considerable period of moving in a consolidation phase and downward pressure, the price has now successfully broken out of the daily resistance area with significantly increased volume support — this is an important point that cannot be ignored.
From the EMA perspective, the price has started to hold above the fast EMA (8 & 14), indicating that short-term momentum is beginning to favor buyers. The daily RSI is also slowly rising from the neutral area, not yet overbought, so there is still room for continuation if the volume remains sustained.
The candle structure shows buyers are starting to boldly take over, not just a technical bounce. As long as the price can hold above the breakout area, a healthy pullback scenario could actually become a continuation opportunity, not a weak signal.
⚠️ Important note:
The large EMA is still quite far above, meaning the larger trend is not fully bullish yet, but the initial phase of a reversal often starts from conditions like this — breakout + volume.
➡️ Current main focus:
Is the volume consistently maintained?
Can the price hold above the new support (previous resistance)?
As long as these two things are maintained, XPL is worth adding to the watchlist for the next movements.