The fundamentals of Sol are fine, and there's not much to say about the long-standing third, so the focus should be on the technical aspects.
The analysis tools I use are just two: Boll and Rsi, and they are at a high level, which is actually completely sufficient.
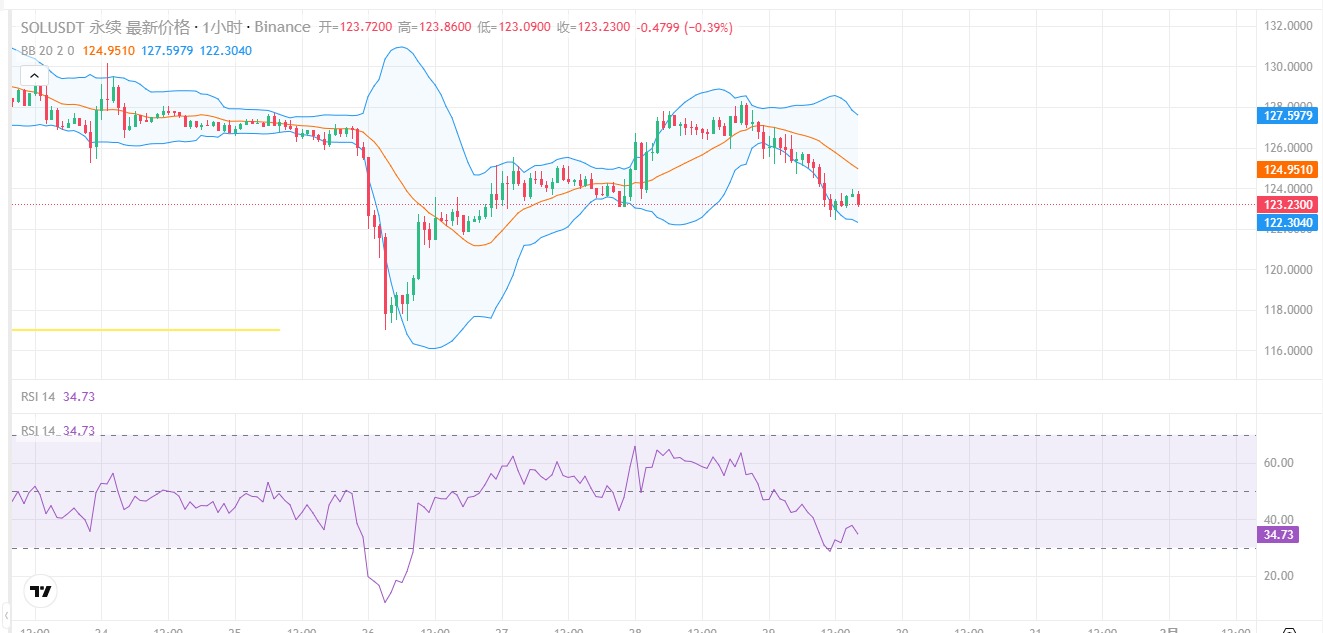
From the daily K-chart, SOL has just experienced a sharp decline, with the price dropping from about 148 (the high on January 13) to around 117 (data from January 25), a decrease of more than 21%.
The current K-line is operating near the lower band of the Bollinger Bands, and the band is opening downwards, which is usually a strong bearish trend signal.
From the key indicators, the RSI value is approximately 37.84.
RSI below 50 indicates a weak zone, but it has not touched 30 (oversold zone), which means the downward momentum may not have fully released yet, or it is undergoing weak consolidation, and no obvious 'bottom divergence' reversal signal has appeared.
Based on Bollinger Band analysis, the price is suppressed below the middle band, which constitutes the largest rebound resistance in the short term.
The support level verification shows that the price on December 18, 2025, is 116.71, while the price on January 25, 2026, is 117 - the 116-117 range constitutes a potential 'double bottom'.
Of course, you can also appropriately 'carve the boat to seek the sword' to look back at the past.
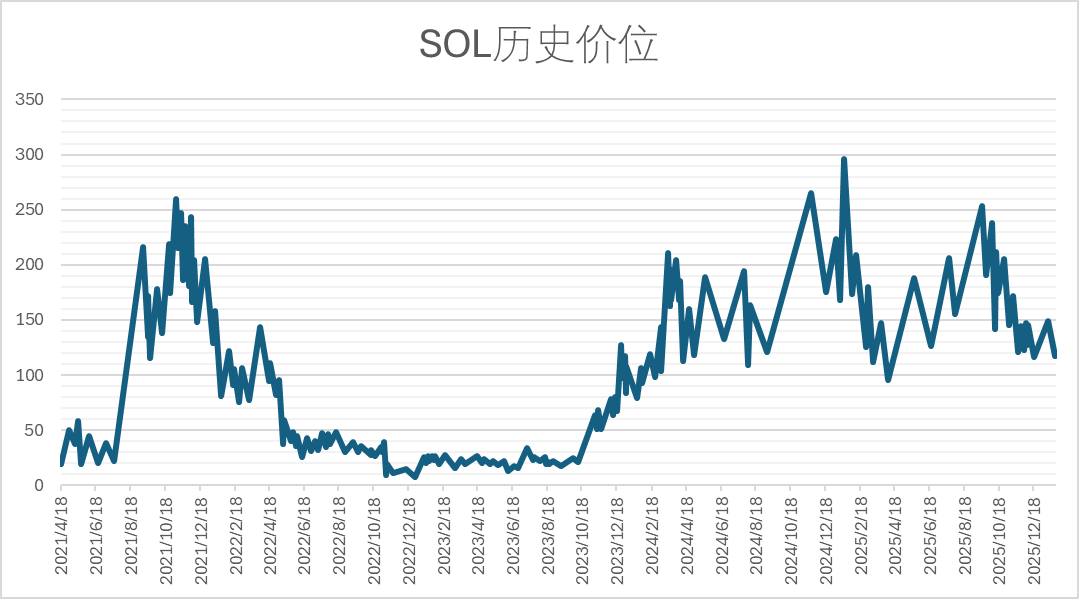
By observing the data from recent years, SOL has shown extremely high volatility.
Historical data shows that when SOL experiences a weekly decline of over 20%, it does not typically immediately V-reverse to a new high, but instead undergoes 1-2 weeks of fluctuating bottoming, often accompanied by reduced volume consolidation after similar declines in 2022 and 2023.
The trend in January 2026 (first rising to 148, then falling back to 117) shows significant market divergence. Historical data does not indicate an absolute 'must rise' or 'must fall' rule in February, but usually, the volatility is narrower than in January.
Here comes the key point, there are three scenarios coming up:
1. High probability scenario: wide fluctuations, testing the bottom.
Currently, the 123.19 belongs to a rebound correction after a sharp drop, but there is heavy pressure above. RSI 37 indicates that buying pressure is weak. The market needs a second confirmation that the support at 116-117 is solid.
At the end of January to early February, prices may retest the 118-120 area. If 117 does not break, a more solid bottom will form. A gentle rebound will begin in the second and third weeks, with the goal of filling the gap in the middle band of the Bollinger Band, looking at prices of 135-138.
The closing at the end of the month may be between 130-135.
2. Pessimistic scenario: break below the neckline.
If the macro environment worsens, or if RSI drops below 30 and cannot recover, leading to 116.71 (the low point in December 2025) being effectively breached.
Once it breaks below 116, stop-loss orders will flood out. The next historical support level may directly look toward the integer level of 100-105. This will initiate a new downward trend.
3. Optimistic scenario: strong reversal.
Fundamental sudden good news (such as a Solana chain ecosystem explosion, ETF news, etc.).
A large bullish candle directly standing above 140 (Bollinger middle band) ends the downward trend, looking bullish towards 155.
So next, what we need to do is focus on two points:
1) Key support levels: 116.5 - 117.0 (lifeline, absolutely must not break).
2) Key resistance levels: 138.0 (Bollinger middle band), 148.8 (previous high).
I will consider dollar-cost averaging into spot, as I believe that 117 is a strong support over the past few months, and around 120 is a relatively safe accumulation area, but one must be mentally prepared for short-term fluctuations down to 100.
Finally, I hope SOL won't disappoint the old investors' expectations and follow an optimistic script!