It is difficult to predict the cryptocurrency market with certainty, but strictly analyzing the technical data, the current outlook looks quite bearish (negative) for several reasons:
1. Sustained negative trend
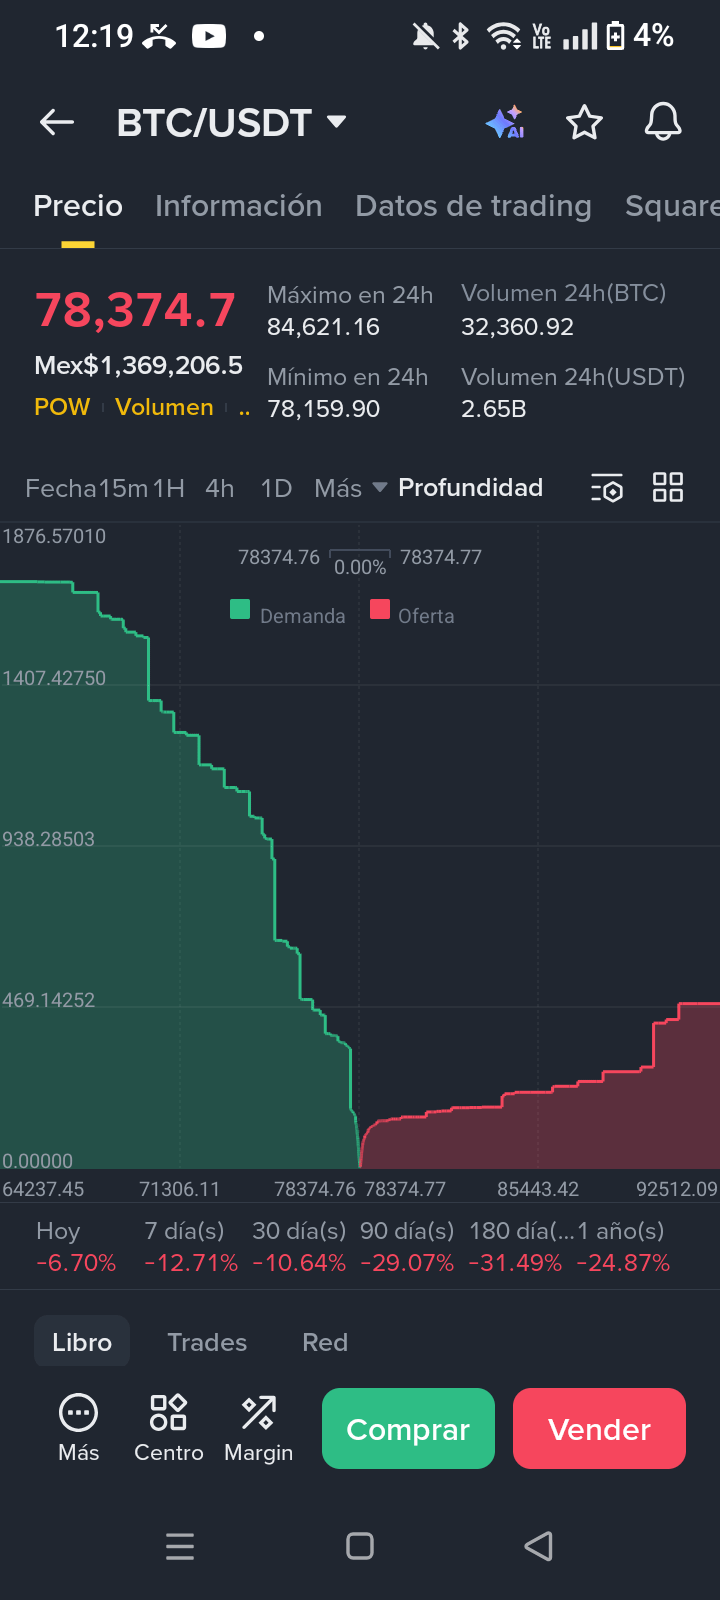
The most concerning are the historical performance percentages at the bottom. All are in intense red:
7 days: -12.71%
30 days: -10.64%
90 days: -29.07%
180 days: -31.49%
This indicates that it is not just a sudden drop today, but a long-term downward trend (a bear market). When an asset loses 30% of its value in 3 months, selling pressure is usually very strong and market confidence is low.
2. Proximity to the day's minimum
Current price: 78,374.7
24h minimum: 78,159.90
The price is operating almost at its lowest point of the day. Generally, when the price closes the day near its minimum, it suggests that sellers are in control and there could be a continuation of the decline the next day.
3. Depth Chart (The green and red zone)
The image shows the order book. Although there is a visible green "wall" (buyers) on the left, the aggressive downward trend suggests that sell orders are "eating" that demand quickly. In such steep declines (-6.70% today), it is common for the price to seek new supports lower down before rebounding.
Conclusion
Based only on this image, market momentum is downward ("don't try to catch a falling knife"). For it to stop falling, we would first need to see stabilization (sideways price) before a rise.
Note: This is just a technical analysis of the image and not financial advice. The crypto market is very volatile.