$BTC 1. Technical Analysis (Micro-structure)
Observing price action and visible volumes:
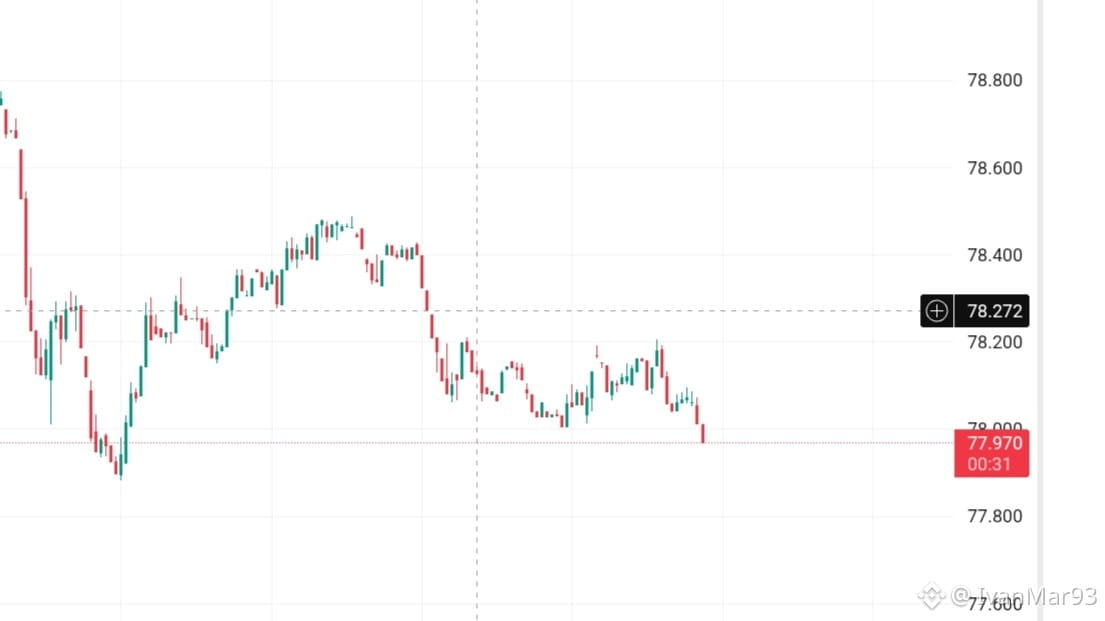
Immediate Trend: The very short-term trend is sideways-bearish. We came from a local maximum above 78.600, followed by a sharp drop (dump) down to the 77.900 area. Currently, the price is trying to stabilize but shows weakness, dropping towards 77.970.
Key Levels (Supports and Resistances):
Immediate Resistance: Zone 78.272 (the visible horizontal dashed line). The price attempted to hold this level but lost it, turning it from support to resistance. Another resistance is at 78.400 (the highs of the previous rebound).
Critical Support: Zone 77,900 - 77,970. The price touched $77,900 (previous low on the left) and bounced back. If it breaks this level with volume, the next bearish target could be lower (zone $77,500 or below).
Volumes:
Volume spikes (bars below) are noticeable during the initial violent drop and the subsequent bounce.
In the last candles (on the right), volumes appear to be decreasing. This indicates a phase of indecision or consolidation. A break of the current support ($77,970) accompanied by an increase in volumes would confirm further downside.
Pattern: A sort of Bear Flag or consolidation following a strong negative impulse seems to be forming. This often anticipates a continuation of the downward movement.
2. Fundamental Analysis (Macro Context)
Fundamental analysis looks at intrinsic value and cannot be fully deduced from a 1-minute chart, but we can make considerations based on the price of ~$78,000:
Price Level (Price Discovery): A price of $78,000 places Bitcoin in a zone of historical highs (or near them, depending on the exact historical moment we are in). Essentially, this indicates that institutional and retail demand is high.
"Store of Value" Narrative: If the price holds at these high levels, it confirms the thesis of Bitcoin as "digital gold" and a store of value against fiat inflation.
Market Drivers:
At this price level, the main drivers are usually inflows into Spot ETFs, central bank policies (interest rates), and corporate/state adoption.
1-minute volatility (fluctuations of $100-$200) is normal market noise and does not change the fundamentals of the asset.
Operational Summary
Bullish Scenario: To turn positive in the very short term, the price must strongly recover to $78,272 and consolidate above it.
Bearish Scenario: This is currently the most likely scenario looking at this chart. If the price closes below $77,970 with increasing volumes, a test of the lows at $77,900 or a drop towards $77,800 can be expected.