
1. Trend Analysis
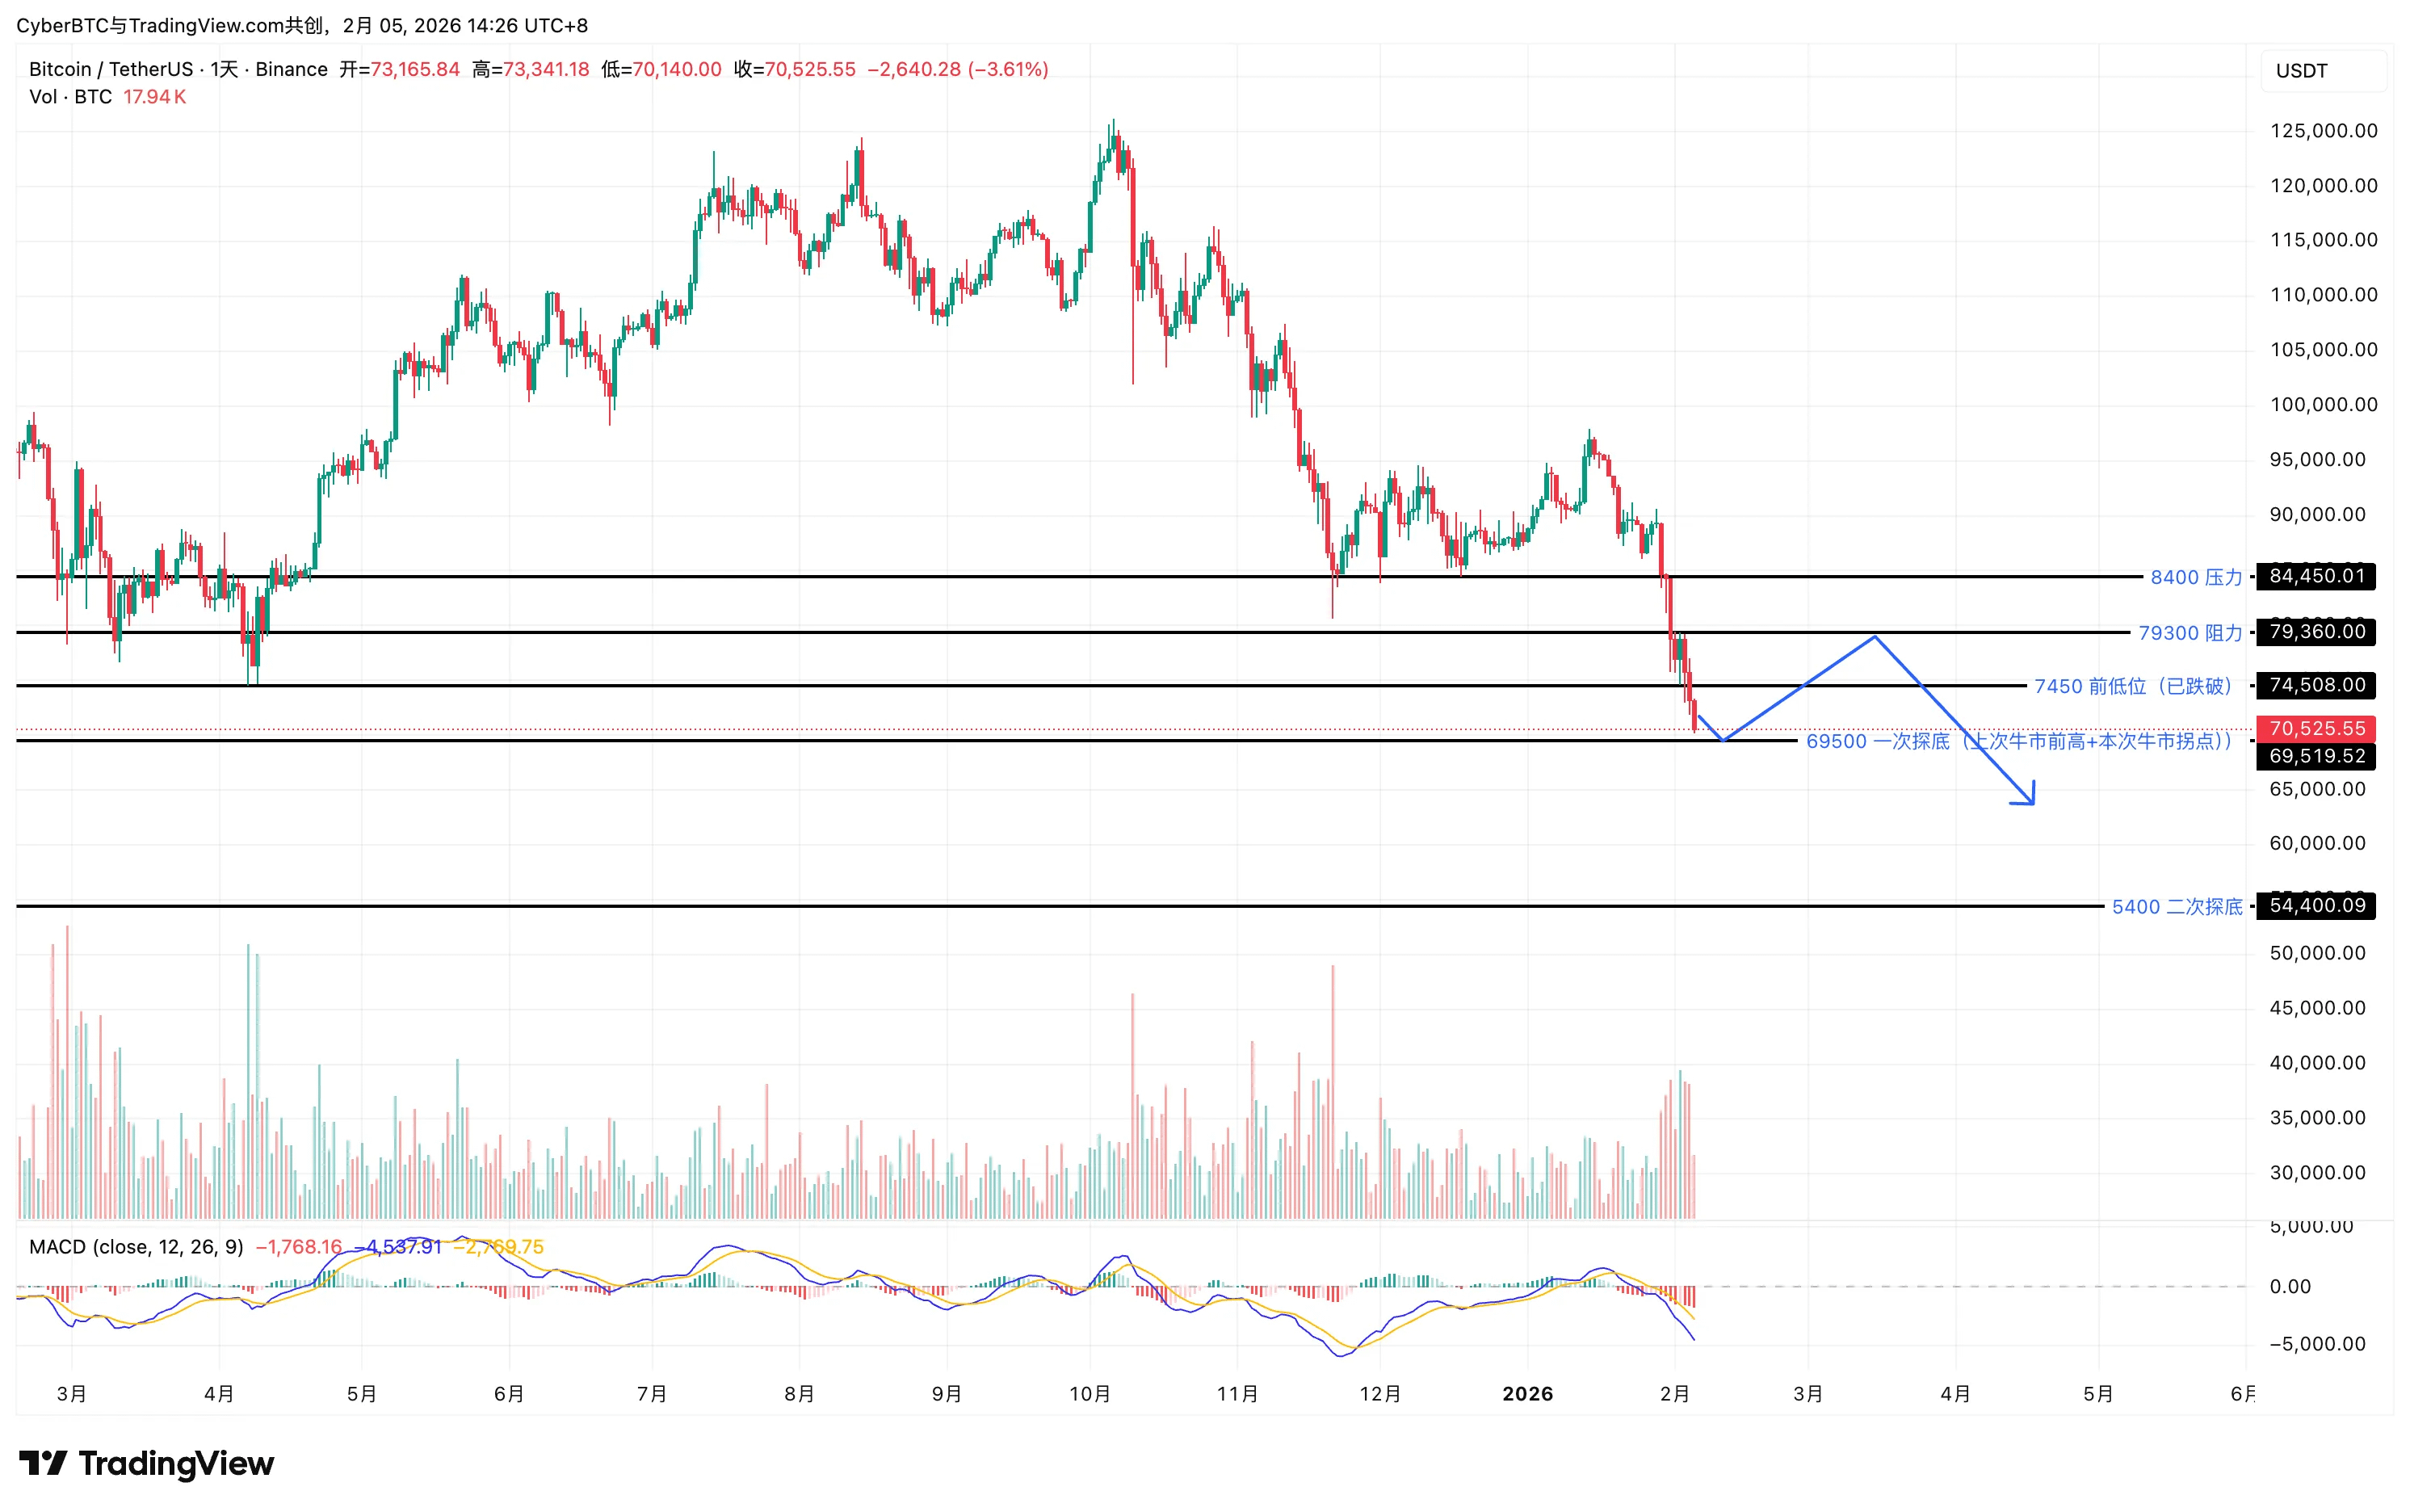
Weekly Level: The market is currently in a downward wave C, with prices approaching and potentially breaking below the key level of $69,500 (this level serves a dual purpose as both the last bull market top and the upper range of the dense oscillation zone in the early stages of this bull market). If it effectively breaks down, the next major target range will point to the $69,500 - $54,000 area, which is also the dense trading zone in the early stages of this bull market.
Potential Evolution: There is also a possibility that prices may find support near $69,500 and stop falling, subsequently forming a new oscillation box between $69,500 and $84,000.
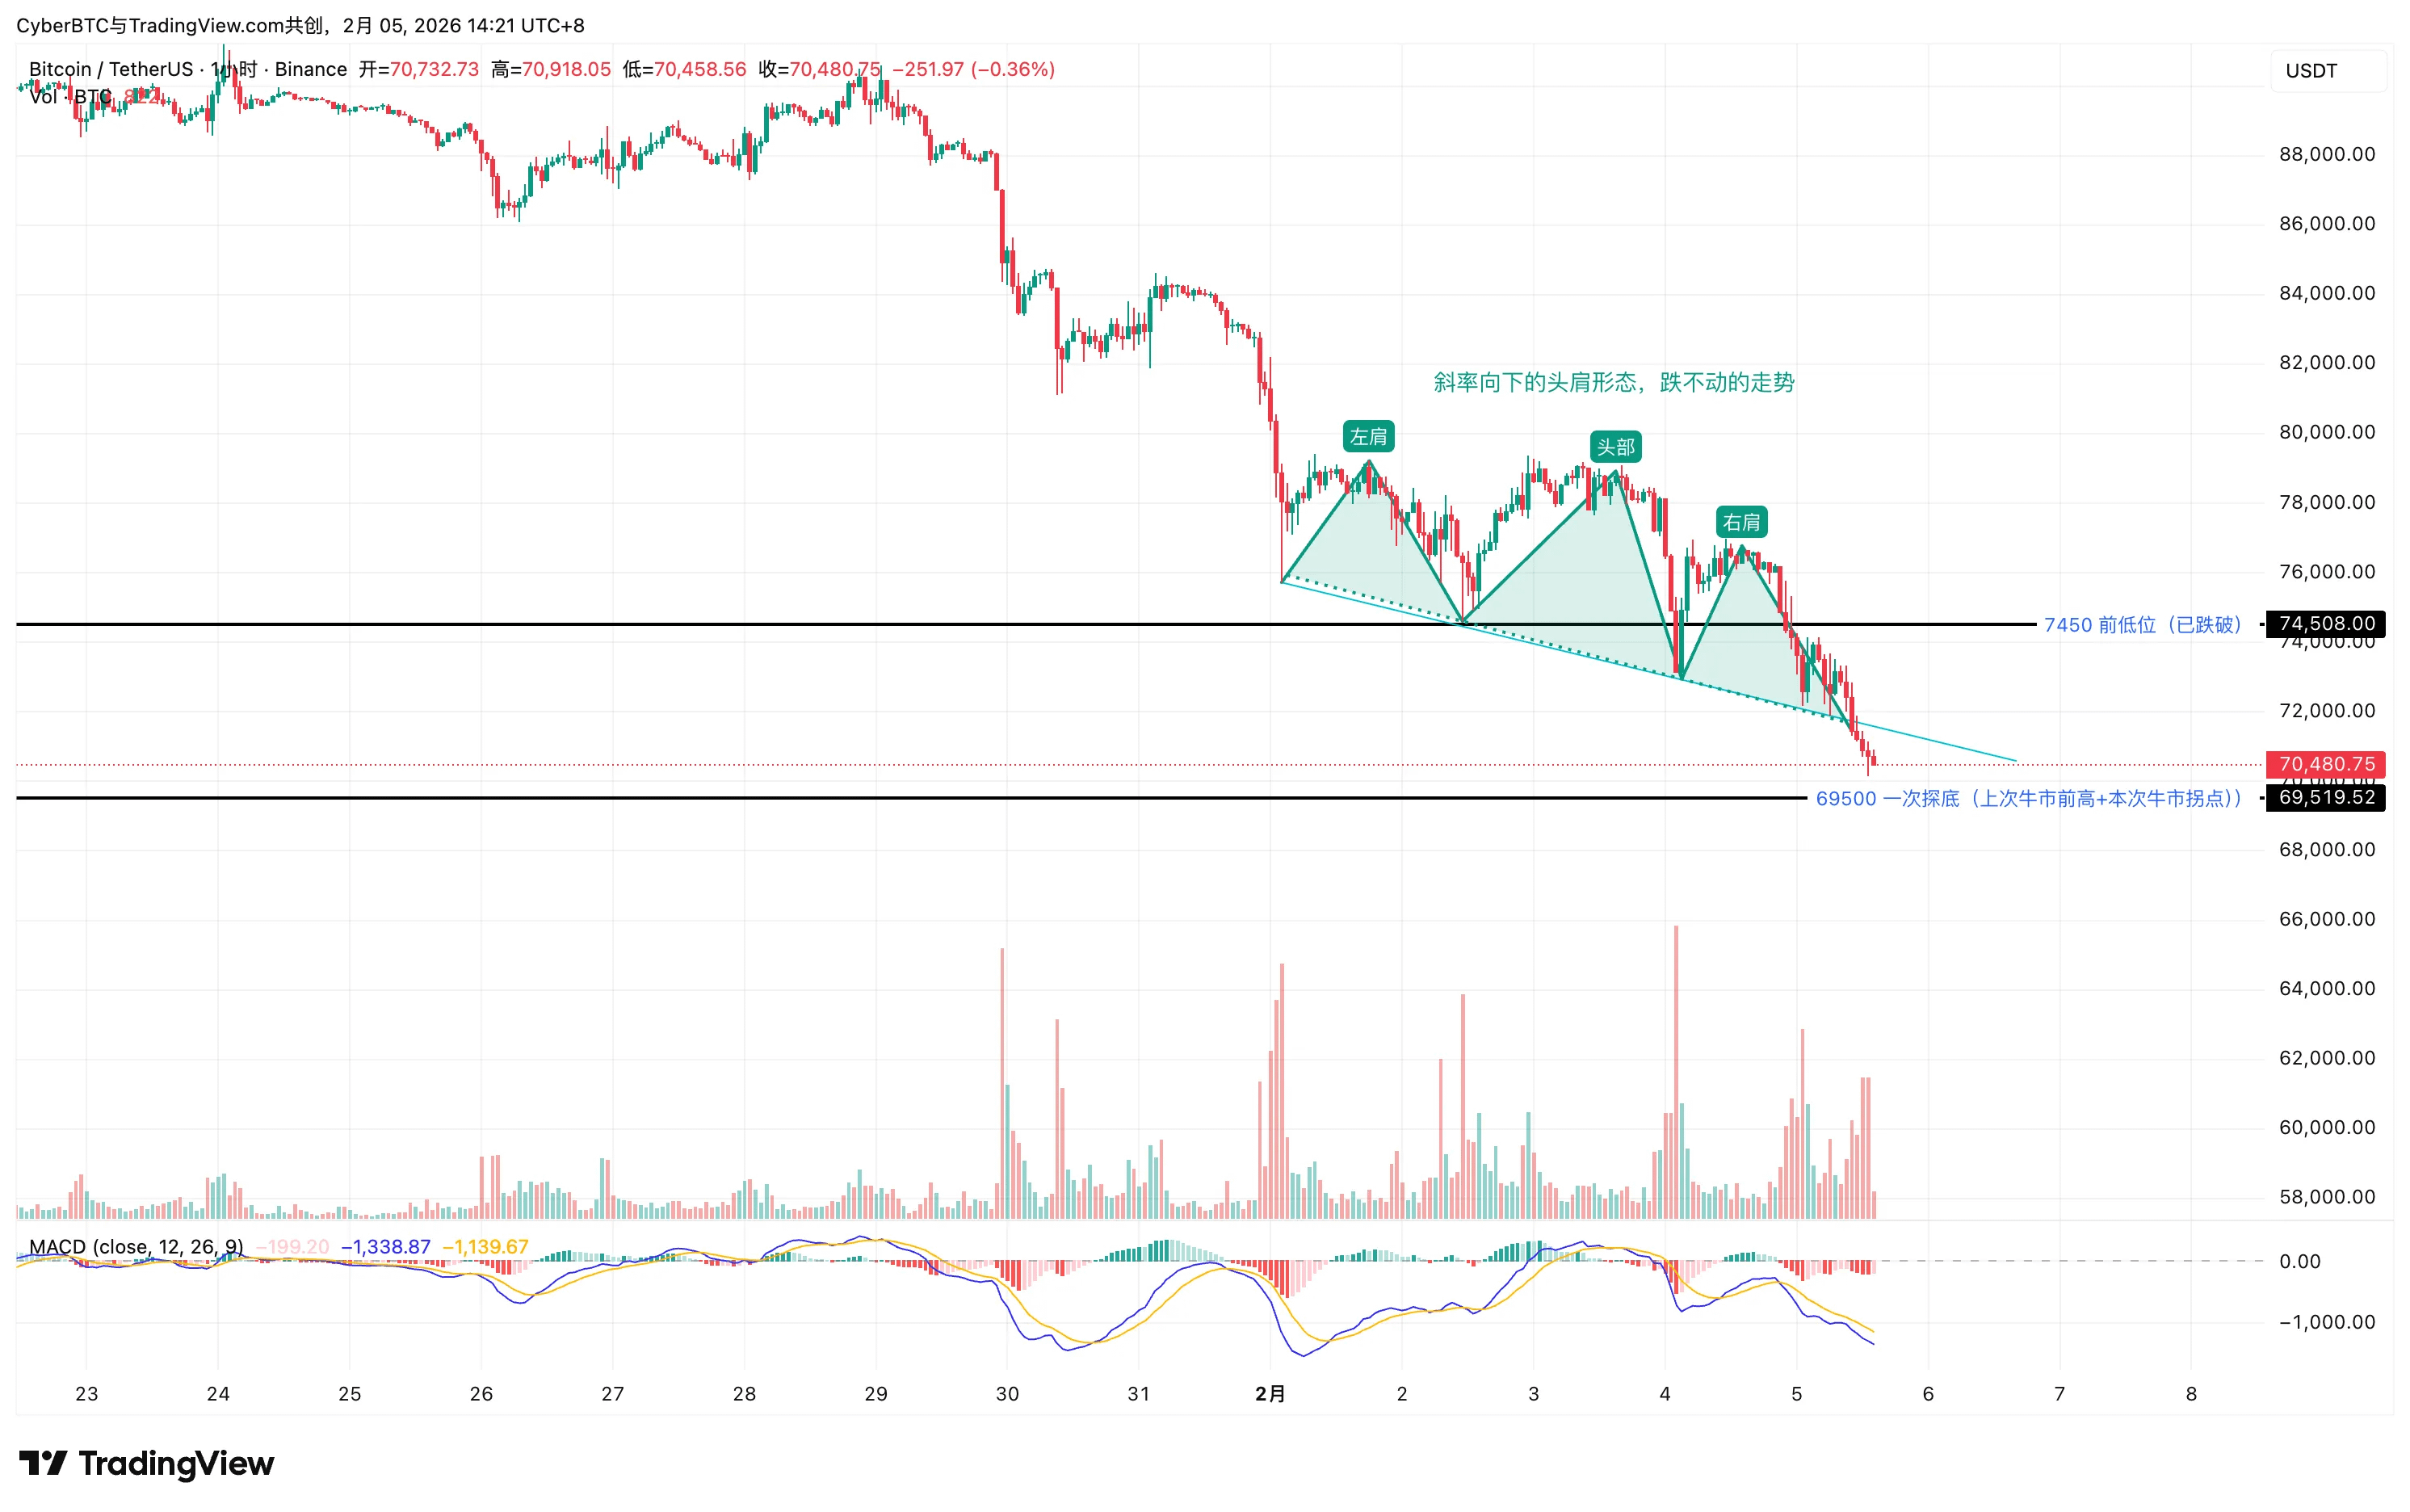
Daily Level: The price has fallen below the previous low of 74,500 and is rapidly approaching the key level of 69,500. The current downward trend shows characteristics of panic selling.
1-Hour Level: A downward sloping head and shoulders pattern has formed on the chart. It is worth noting that this gradual decline pattern is usually not a sign of a one-sided crash. A rapid drop is often accompanied by a quick rebound to attract bulls to chase higher, while a sustained, slight decline may indicate that bearish liquidity is gradually drying up—when market consensus is extremely bearish, the momentum and space for continued decline may actually be limited.
Short-term Prediction: The price is likely to test the key level of $69,500 to assess the support strength and market liquidity at that position.
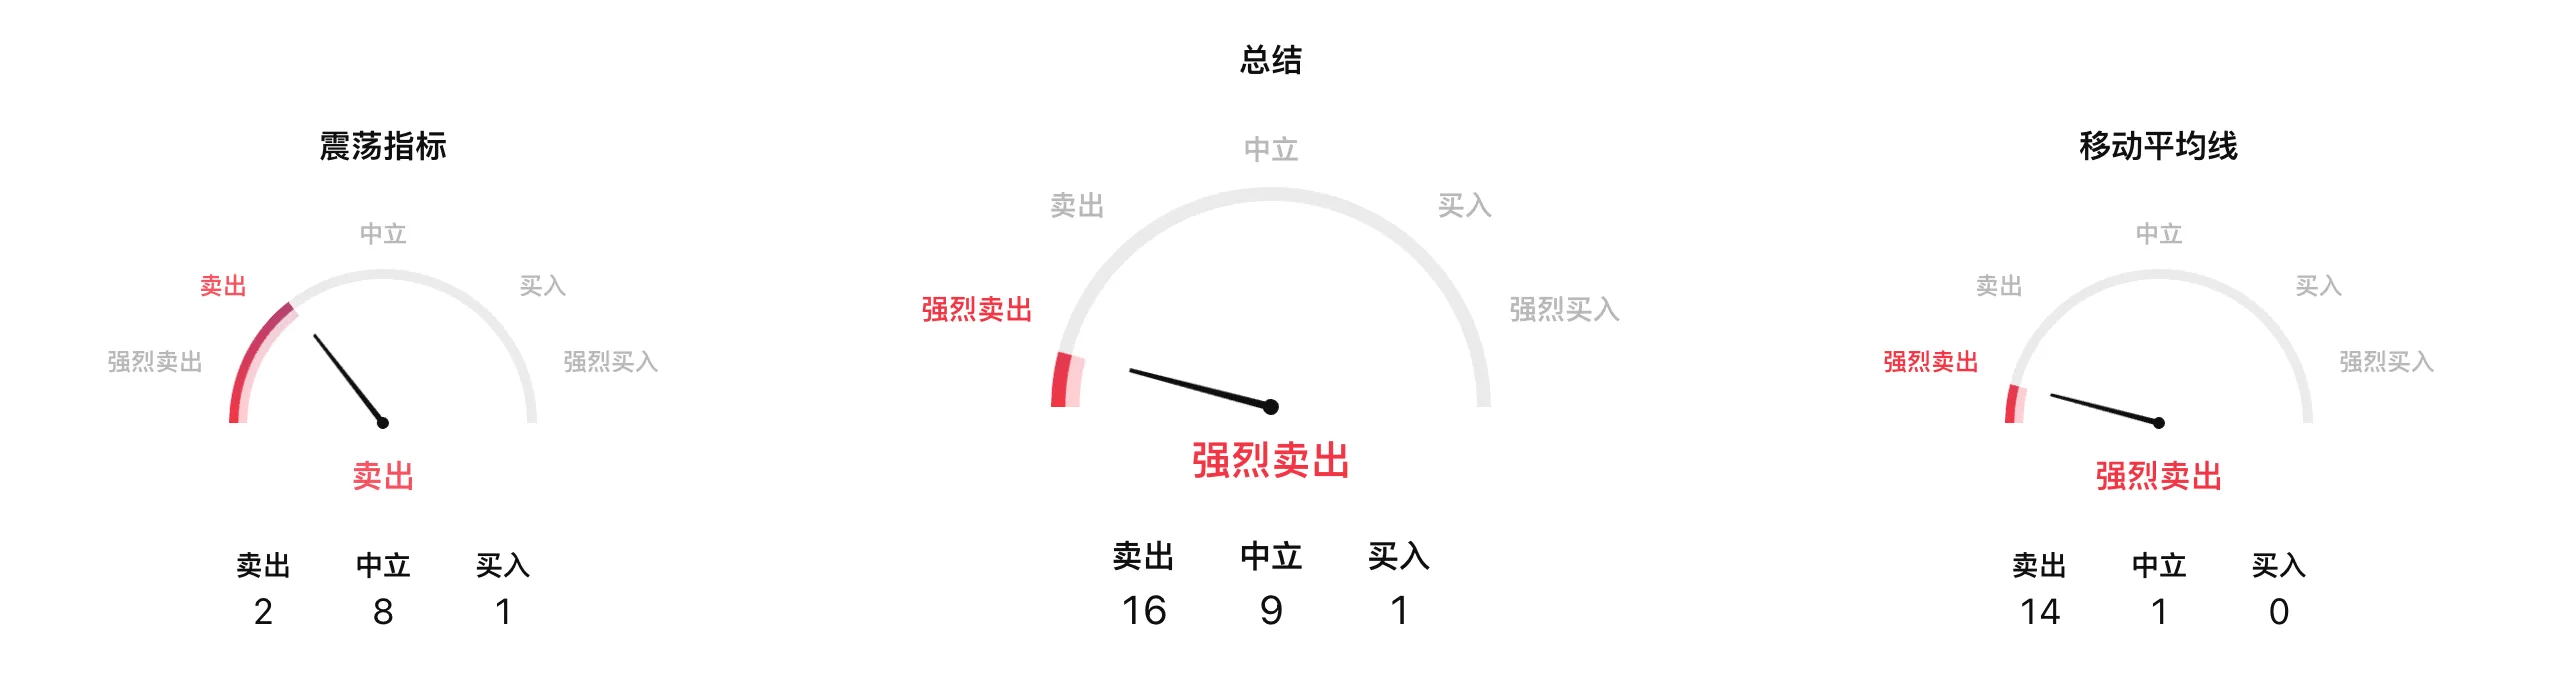
Other Indicators: The market's fear and greed index has reached the extreme fear zone. When market sentiment is uniformly bearish, downward selling pressure may weaken due to a lack of counterparty, increasing the likelihood of a technical rebound near key support levels.
2. Key Price Levels
Resistance Levels: $74,500, $84,000
Support Level:
$69,500 (Key Level): If this level is broken with increased volume and not quickly recovered, it will open up greater downward space, making future market predictions difficult.
$54,000 (speculative support based on historical structure)
3. Operation Suggestions
The current strategy should primarily focus on cautious observation and avoid blind actions.
Avoid blind shorting: The market is nearing a key support level, and bearish momentum may weaken, making the risk-reward ratio for shorting unfavorable.
Avoid guessing rebounds: Do not prematurely predict the bottom and attempt to bottom-fish before clear reversal signals appear at key levels.
Core Observation Point: Closely monitor the price dynamics around $69,500.
Scenario One (Breakdown): If the price breaks below $69,500 with increased volume and does not rebound, the market may enter a wide-ranging downward consolidation zone of $69,500 - $54,000.
Scenario Two (Support): If the price shows a long lower shadow (wick) near $69,500 and rebounds strongly, it may form a range consolidation pattern of $69,500 - $74,500 - $84,000.
Summary: The price has approached the critical bull-bear watershed at $69,500, which is not an ideal entry point. The subsequent market trend is full of complexities, and investors should remain patient, waiting for the market to make directional choices at key levels before making decisions.

1. Trend Analysis
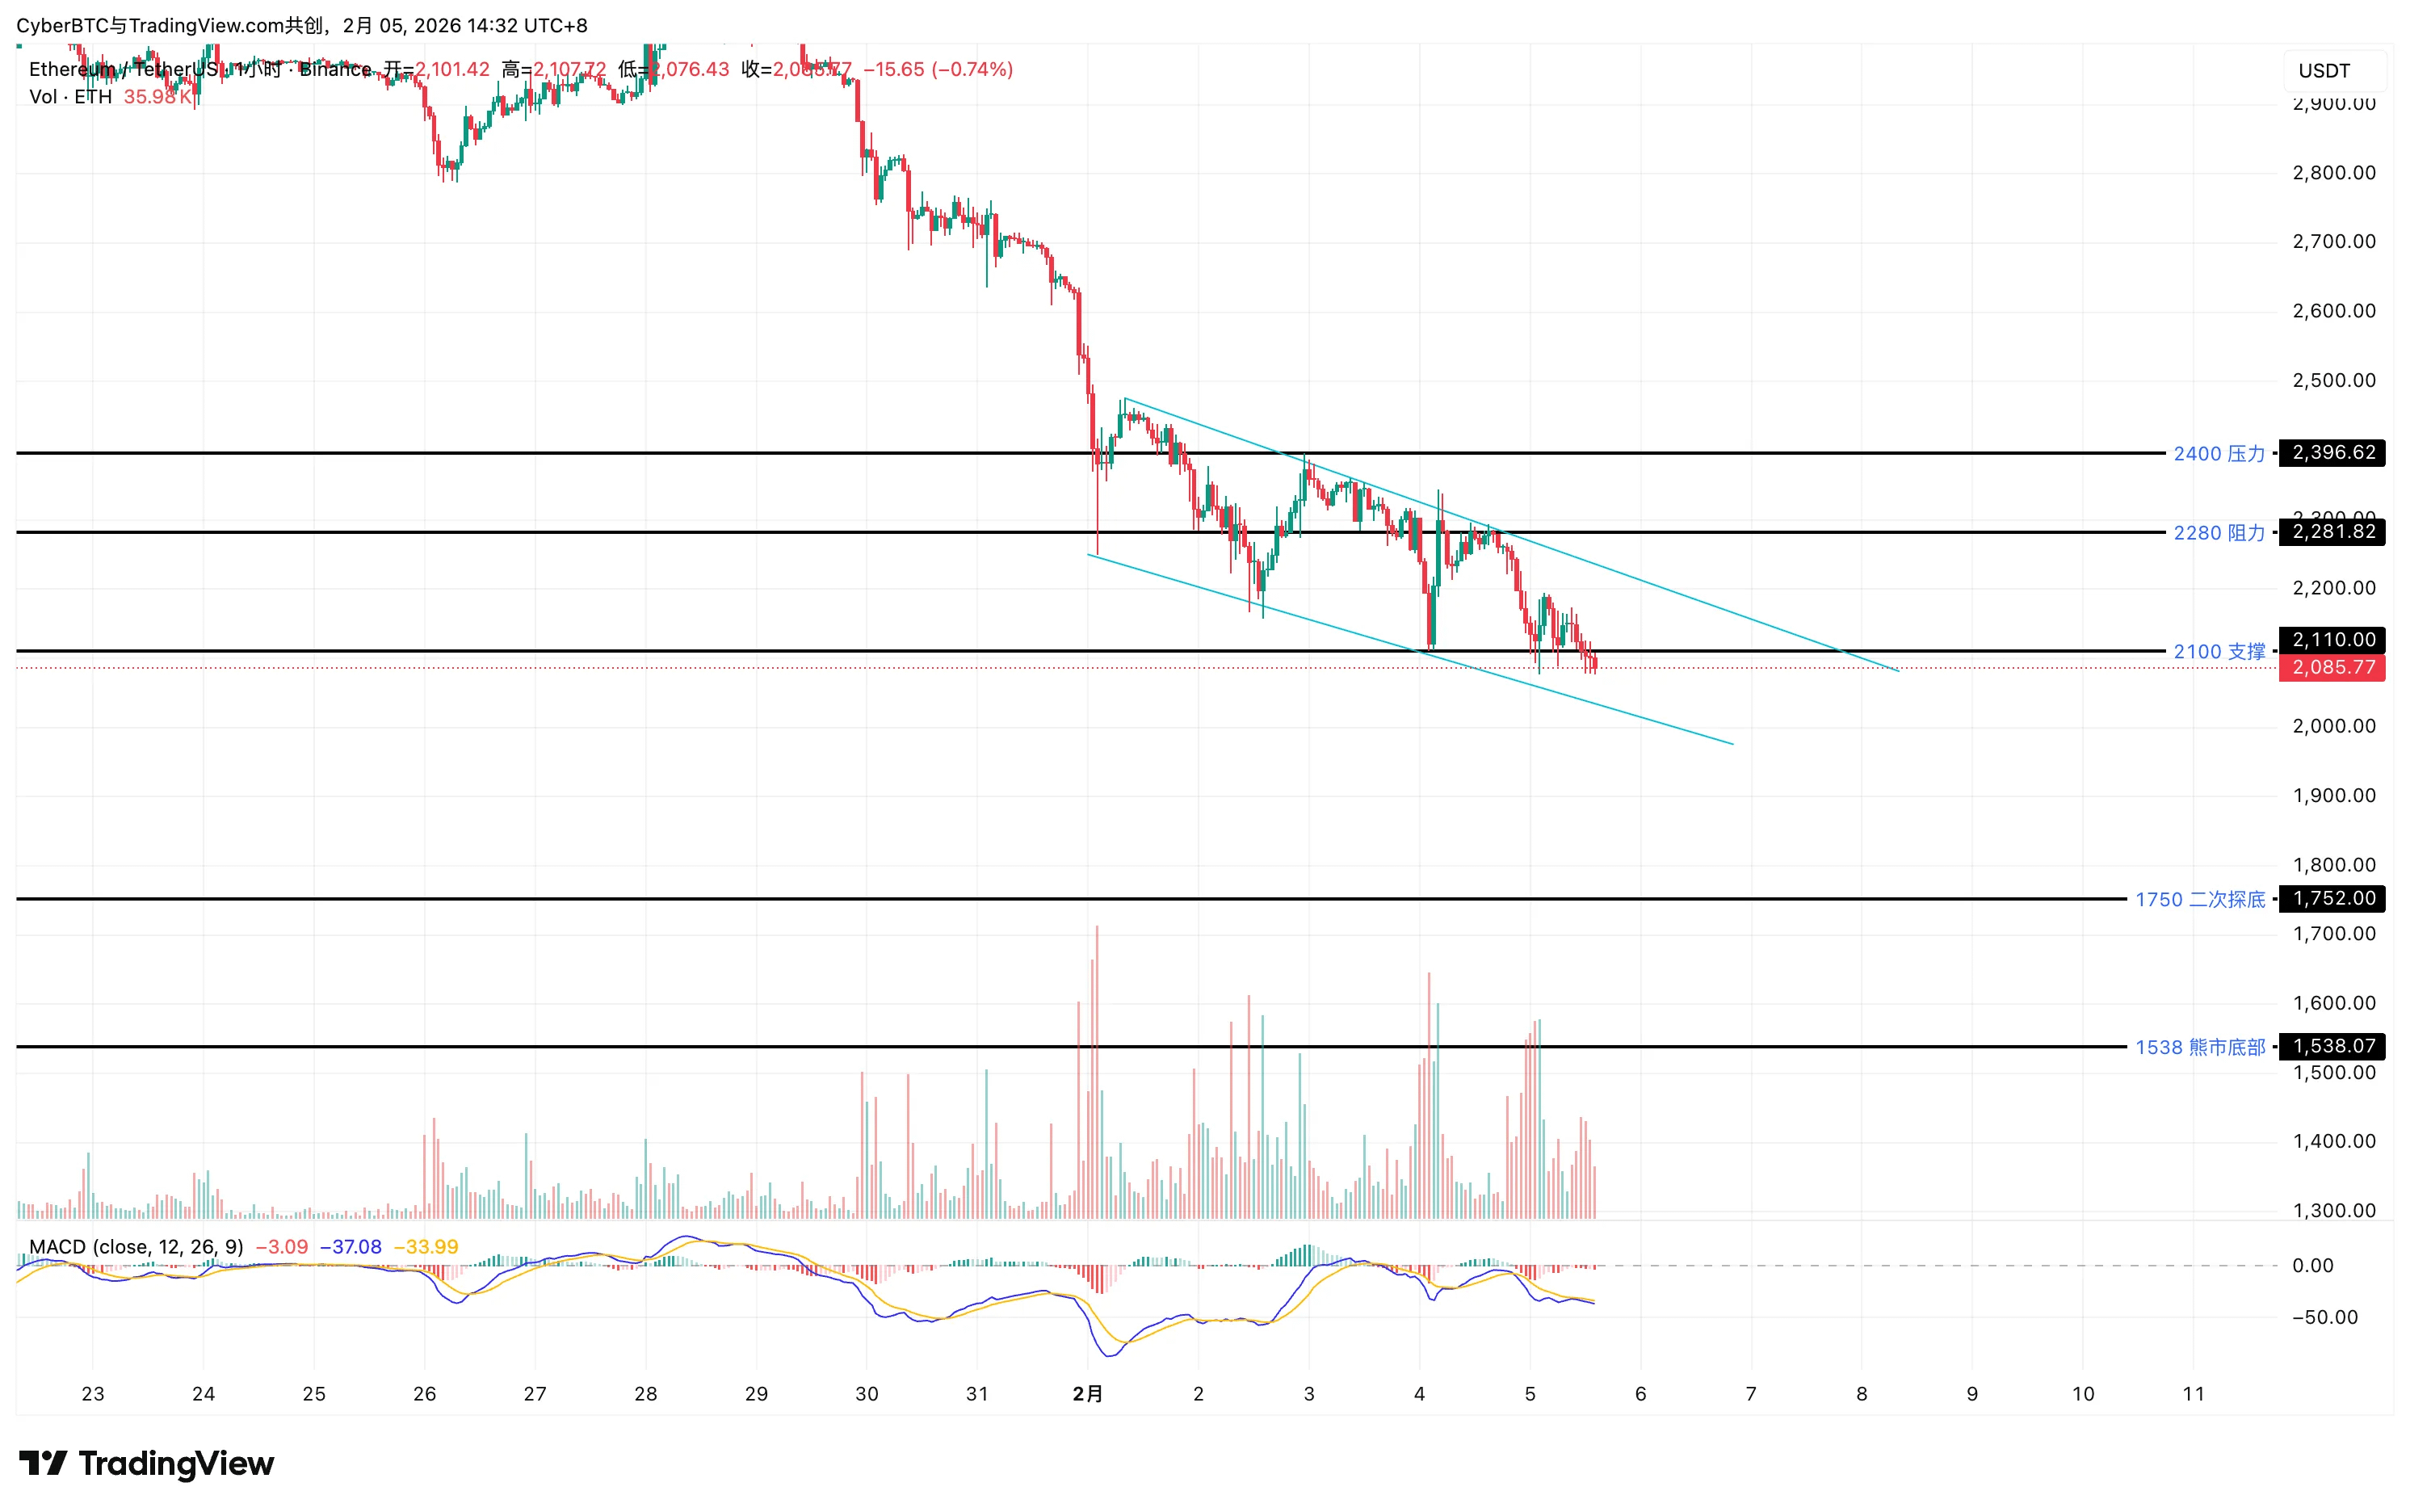
Daily Level: The price has fallen below the previously predicted consolidation range, and the key support level of $2,100 has been lost. The market is entering the next phase of testing, targeting the range of $2,100 - $1,750.
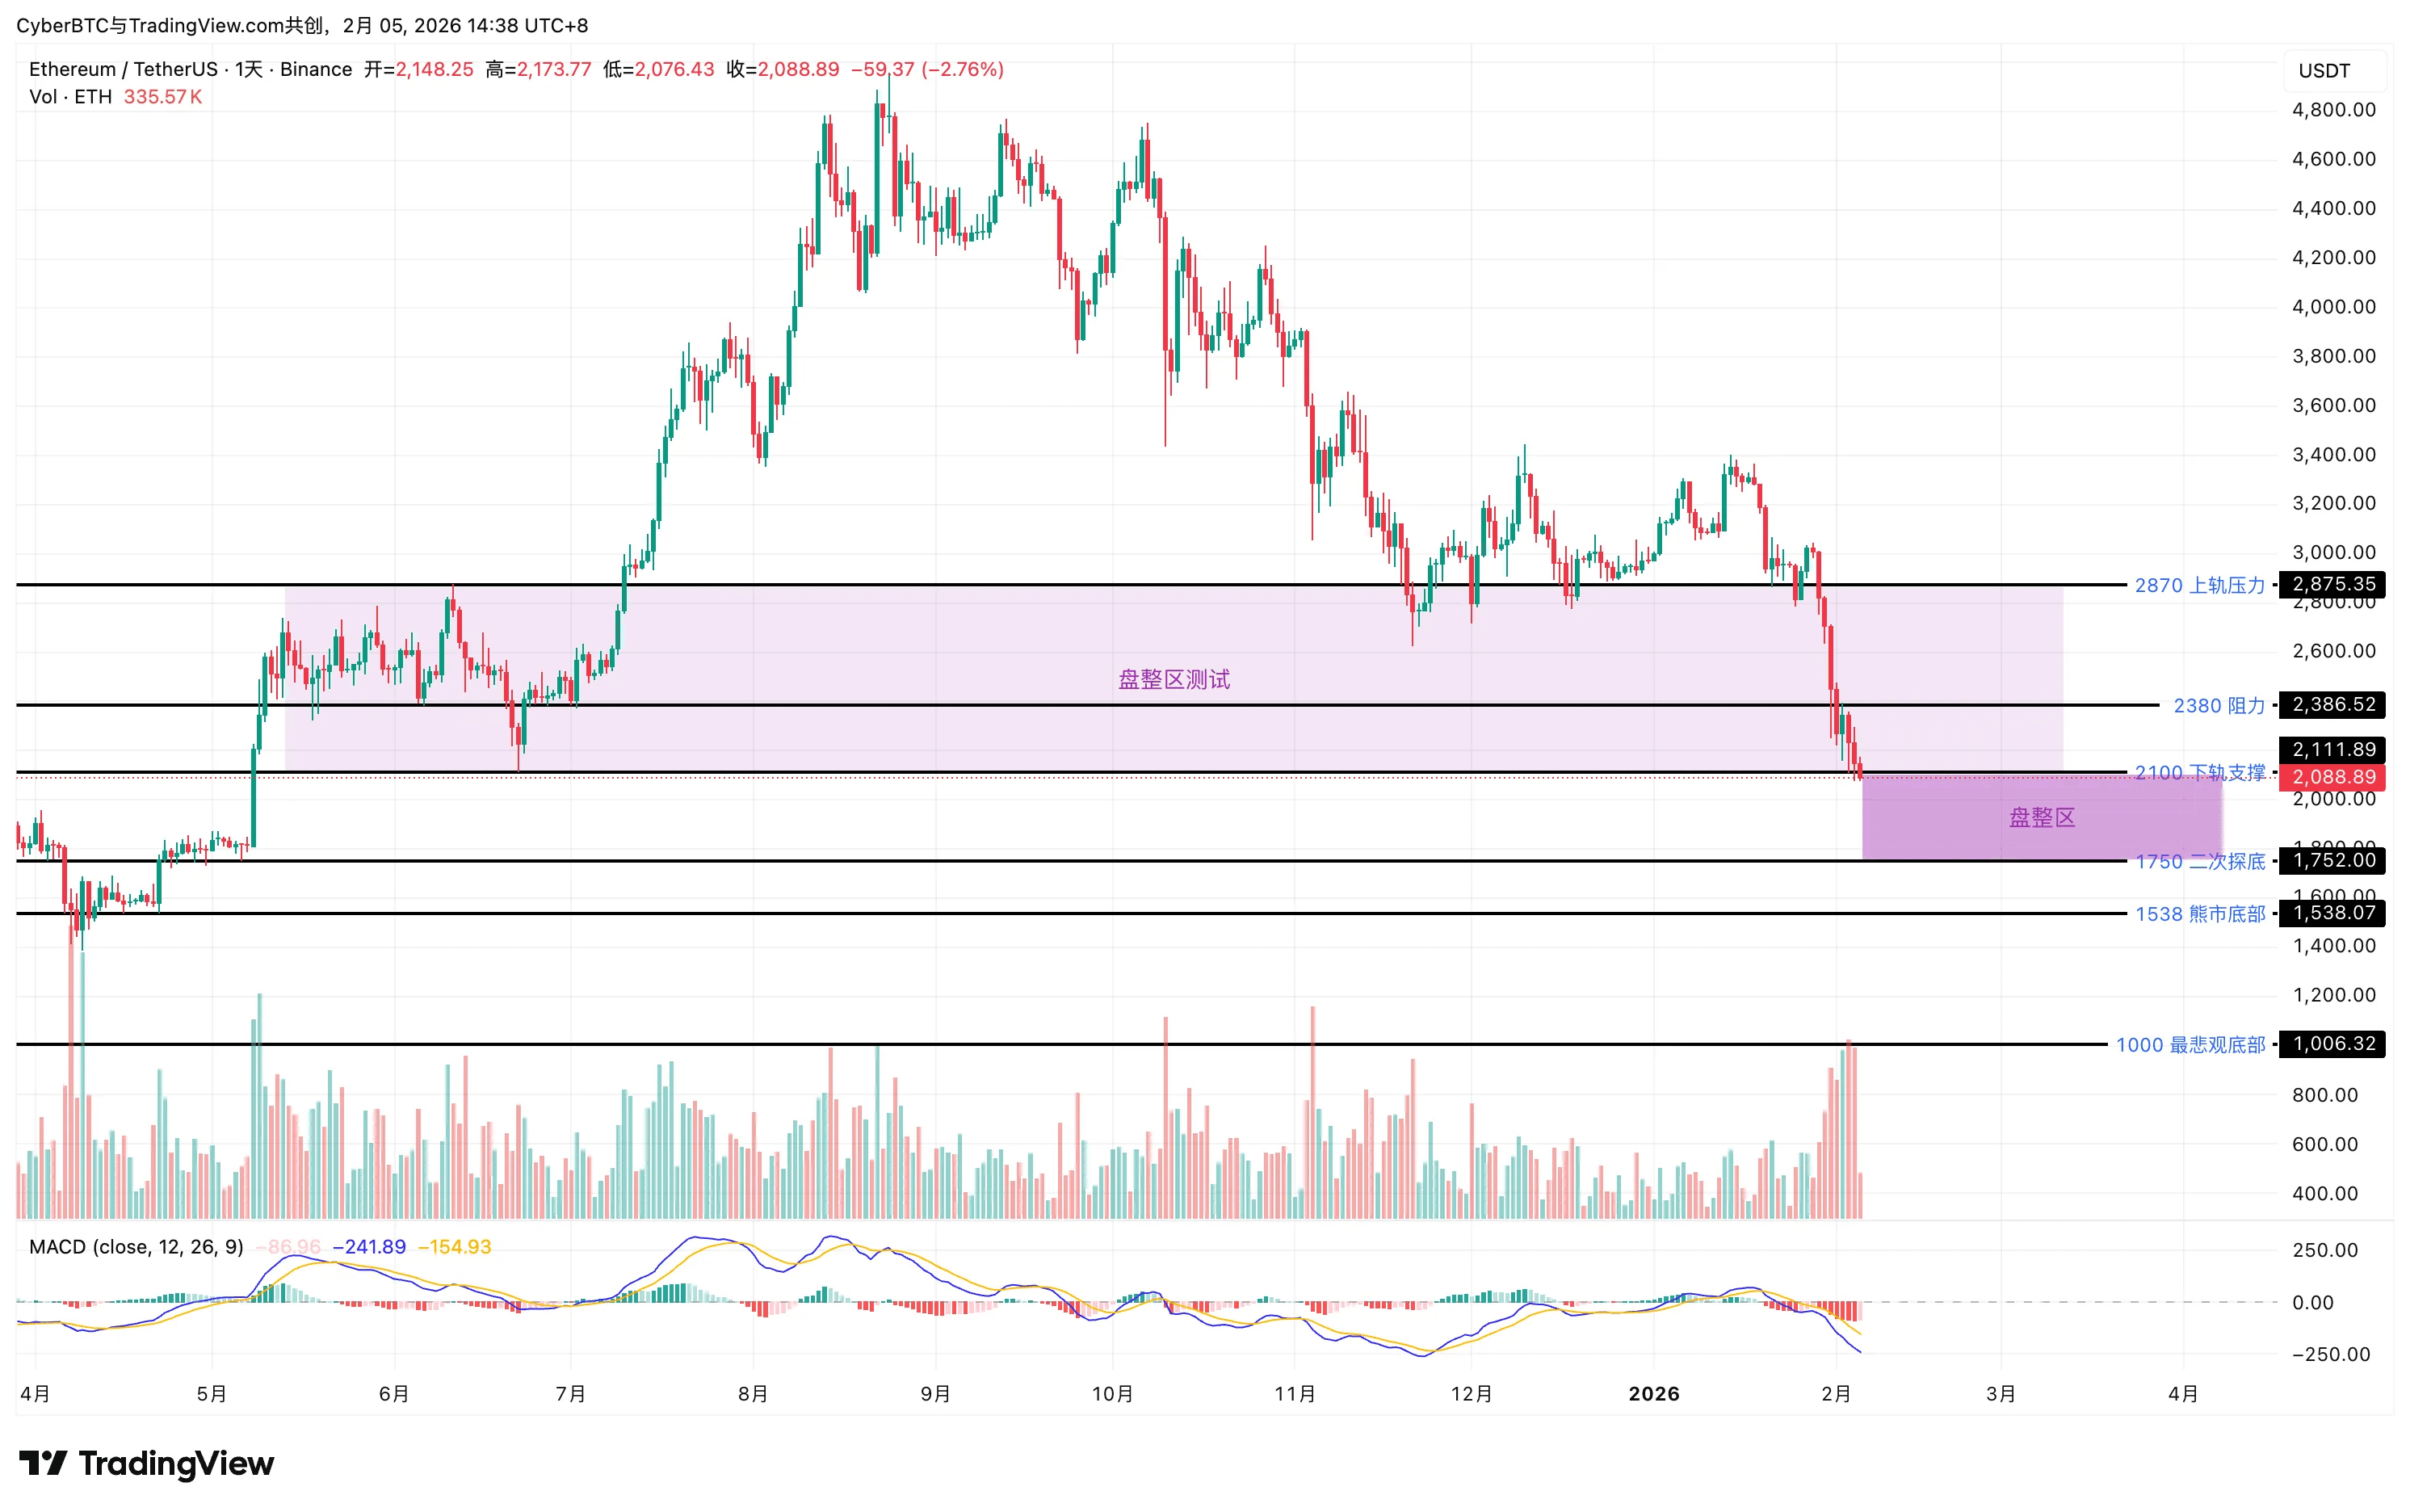
1-Hour Level: A descending flag pattern has formed. There is a lack of clear historical support in the range of $2,100 - $1,750, leading to high uncertainty in subsequent price paths. This phase is typical of a "trading dark zone," where price behavior is difficult to predict, and it is advisable to avoid.
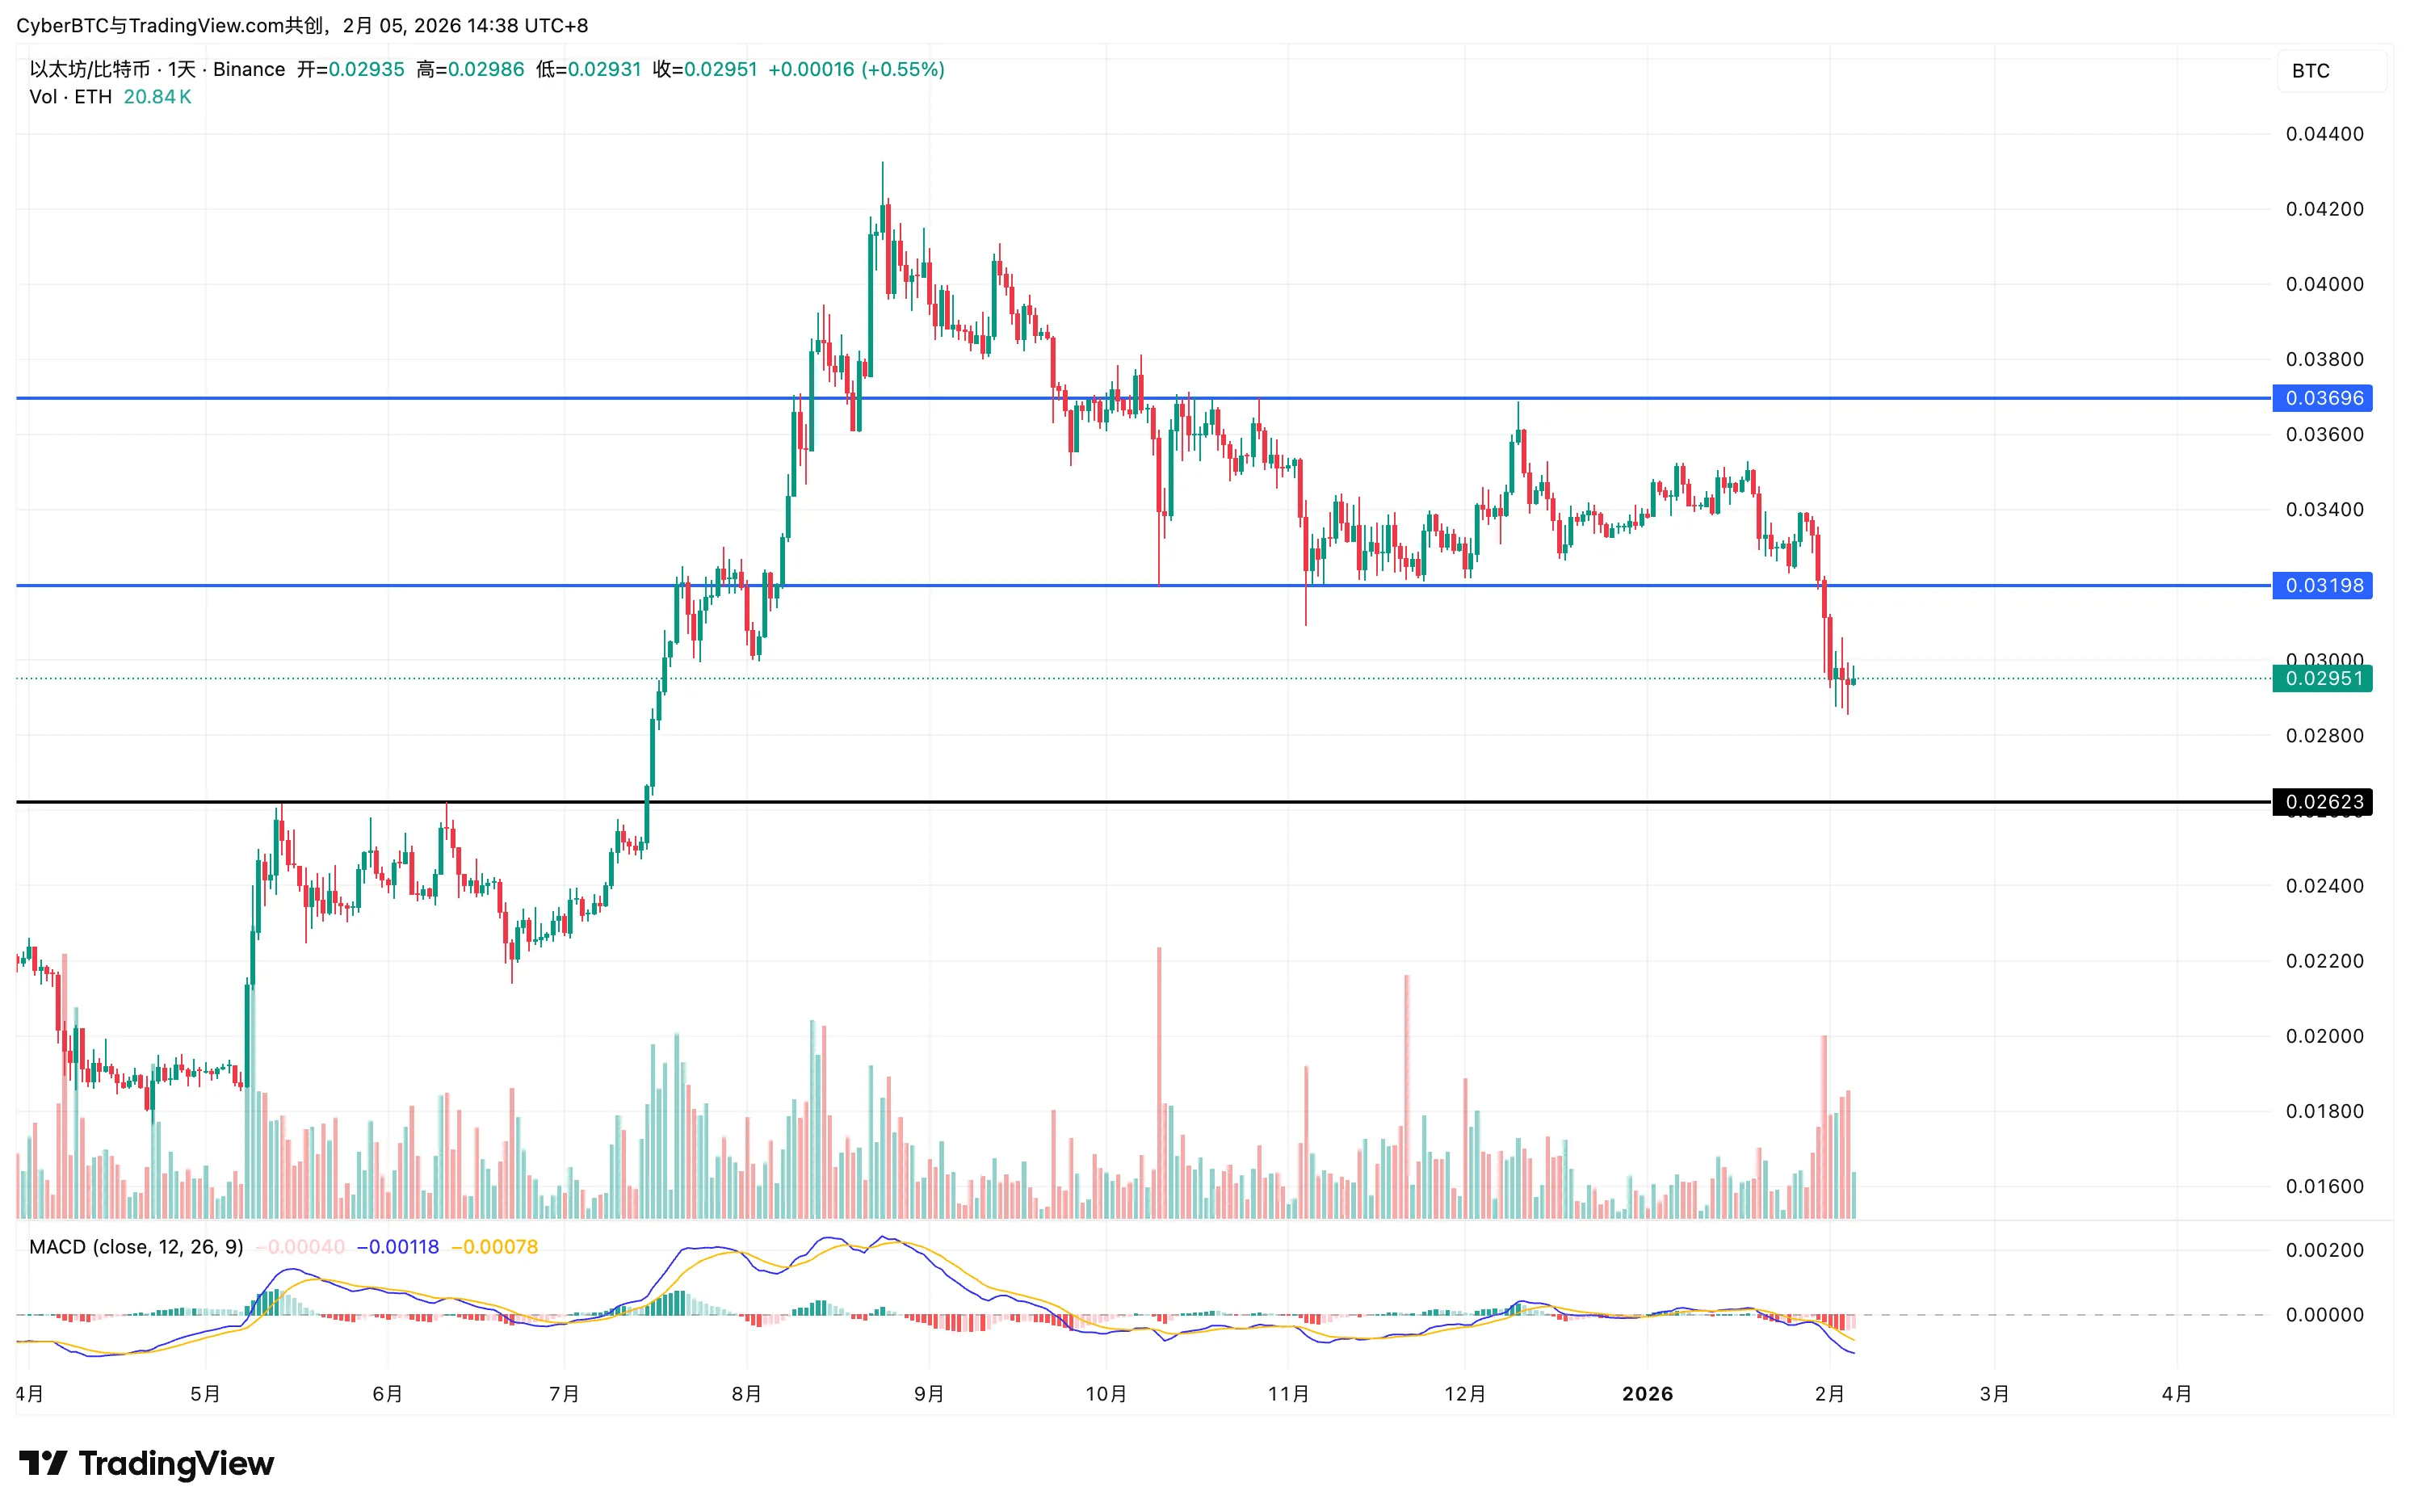
ETH/BTC Exchange Rate: The exchange rate has not experienced a collapse-like drop, and currently shows signs of stabilizing. This indicates that there has not been a large-scale panic sell-off against ETH in the market, and ETH is still primarily following BTC for correlated fluctuations.
2. Key Price Levels
Resistance Levels: $2,280
Key Testing Level: $2,100 (transformed from previous support to resistance)
Support Levels: $1,750, $1,538 (speculative support based on historical structure)
3. Operation Suggestions
The operational thinking is highly consistent with BTC: maintain a wait-and-see approach, waiting for confirmation at key levels.
Currently not a good entry opportunity; focus on observing the price reaction around $2,100.
Scenario One (Effective Breakdown): If the price breaks below $2,100 with increased volume and has weak rebounds, the next target will point to around $1,750.
Scenario Two (False Breakdown): If the price briefly dips below $2,100 and then quickly rebounds strongly, it may return to the wide-ranging consolidation zone of $2,100 - $2,870.
Summary
The overall sentiment in the crypto market is extremely gloomy. Despite being in a bear market atmosphere, the continuous decline has consumed a lot of bearish momentum, and the downward liquidity in the market is decreasing. This actually provides conditions for the price to form a consolidation platform in key areas.
Core Advice: Avoid being swept away by the market's uniform pessimism and blindly shorting. The future market is full of complexities, which may lead to a breakdown downwards or gain support at key levels and shift into consolidation. All decisions should be based on the actual performance of BTC at key price levels, maintaining restraint and patiently waiting for clearer market signals.