Stop… Stop… Stop…
Drop everything and focus here 👀
I want your full attention now, because I will explain the movement $BTC exactly as shown by the chart — no exaggeration, no bias, just price structure and logic.
This is the view on the big time frame for Bitcoin, and the following is my personal opinion on the upcoming movement, based solely on price action, levels, and momentum.
Everyone on the timeline is shouting: “Buy the dip” or “Go short hard.”
But only a few read what the market is actually saying.
So let's take a moment and look at the facts.
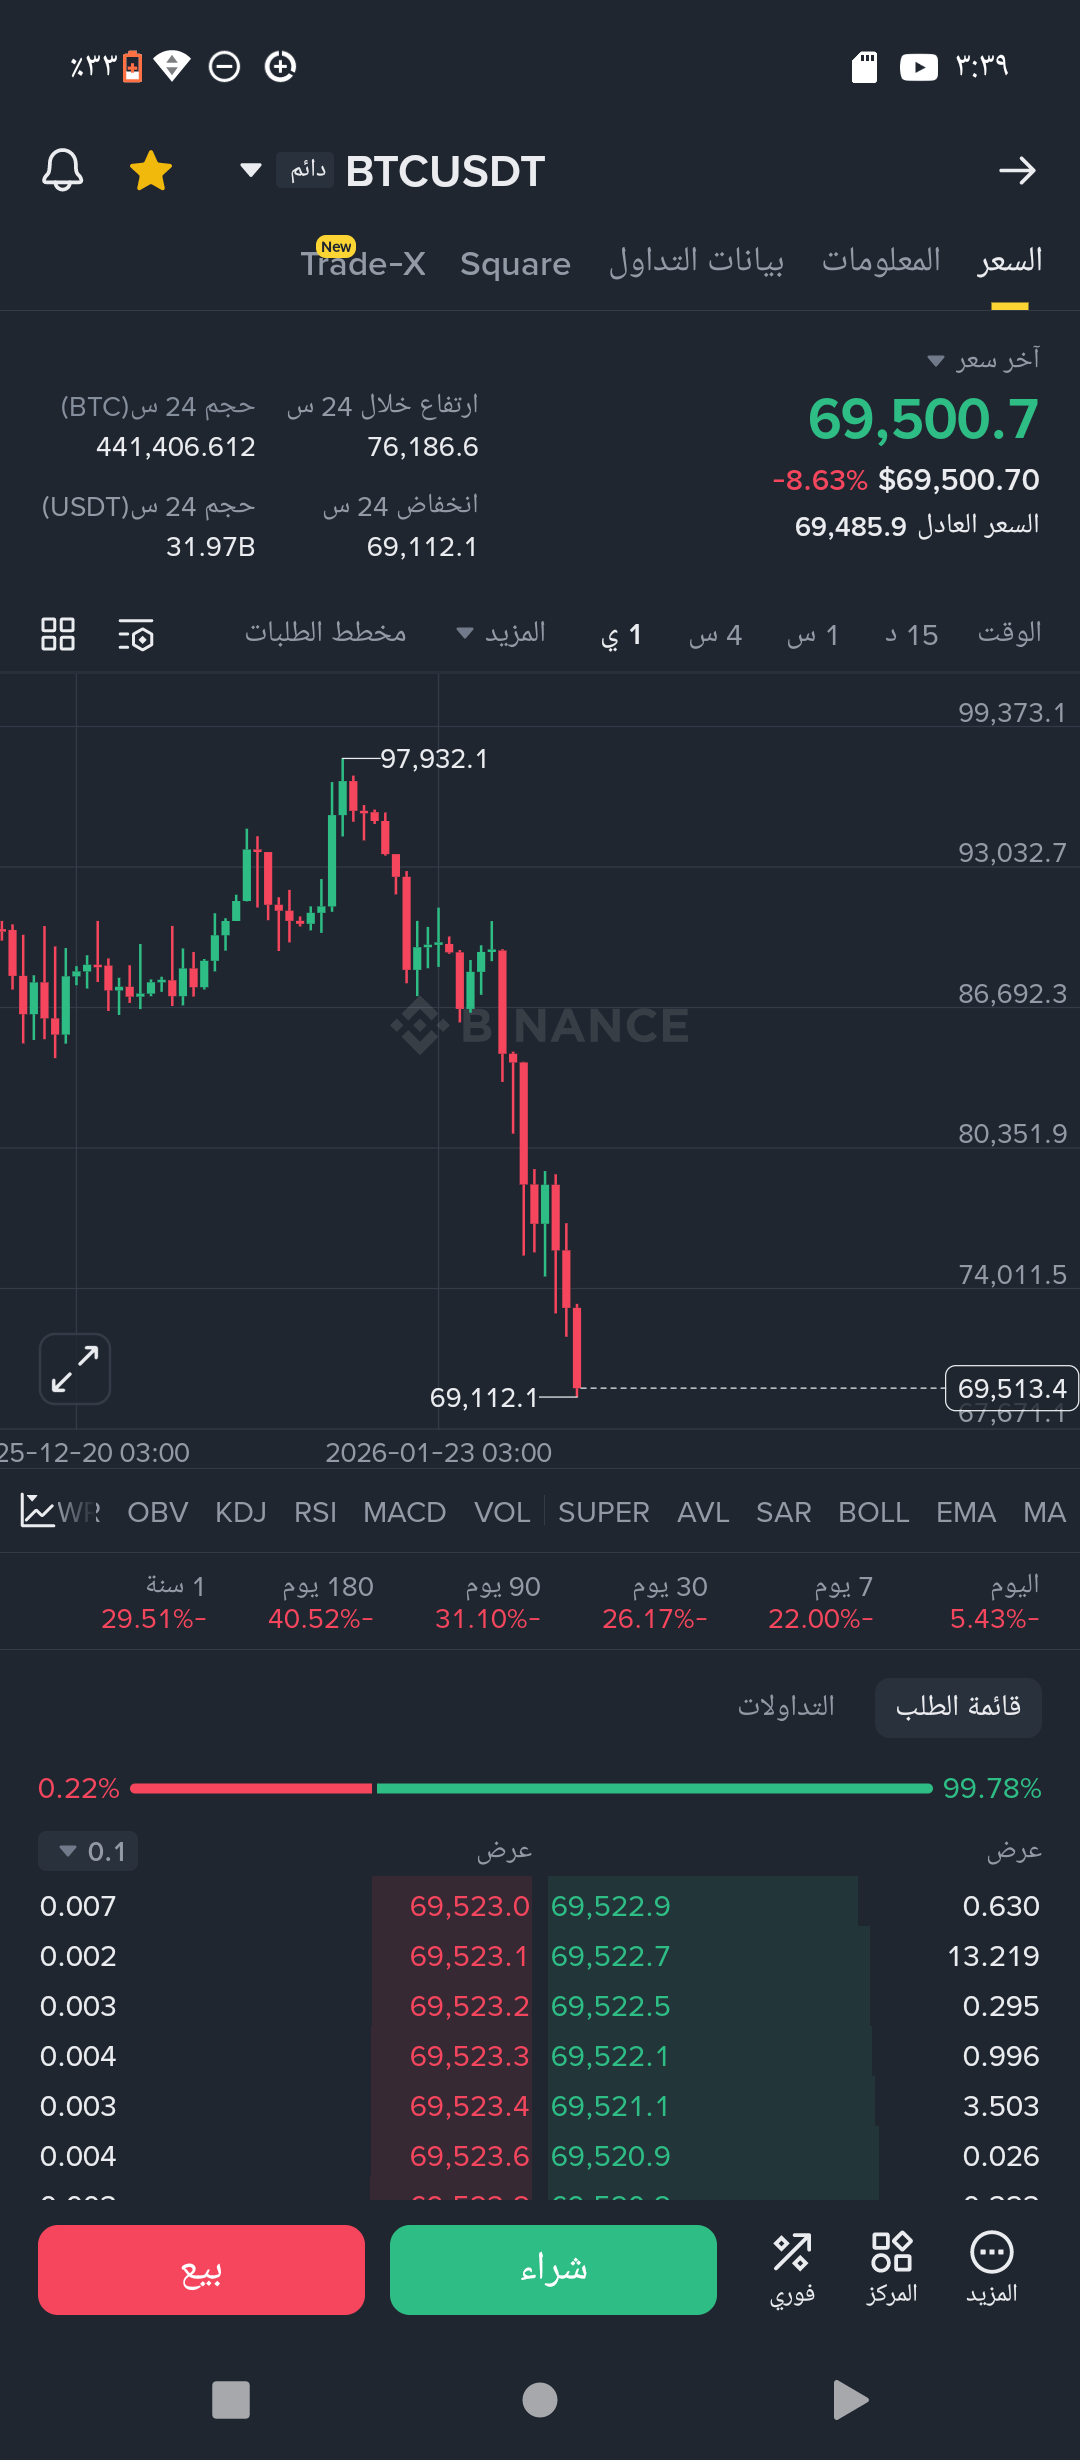
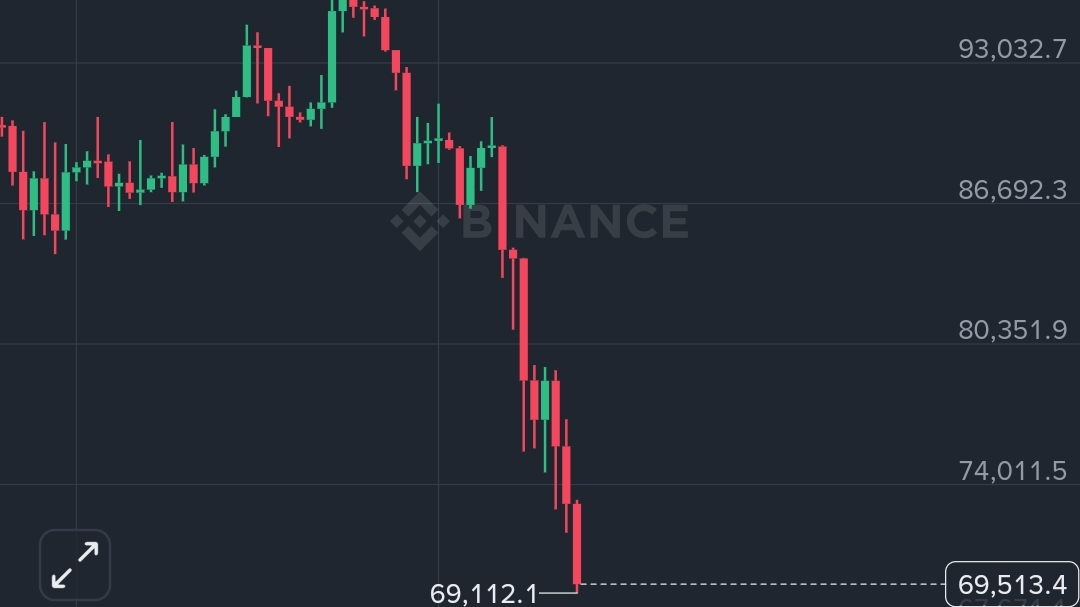
Look closely at the chart:
BTC has faced several rejections from the same supply area between 79,500 and 76,300.
Every attempt to rise has been sold off heavily.
And this tells us one clear thing:
👉 Sellers are still in control.
Currently, BTC is trading near 71,600, above an important demand area between 70,500–70,000.
This area has already been tested, but each bounce has become weaker than the last — a classic sign of increasing selling pressure.
And here's the critical part:
If BTC breaks the 70,000 level with a strong close, liquidity will open directly towards 69,600 and below 27$BTC
Support in this area is very weak, and the price could move quickly.
On the other hand, let's clarify when the scenario actually becomes bullish:
It won't turn $BTC bullish unless it recaptures the 76,300–77,000 area with strong volume and price stability.
Until that happens, every rally is just a lower high within a larger descending structure.