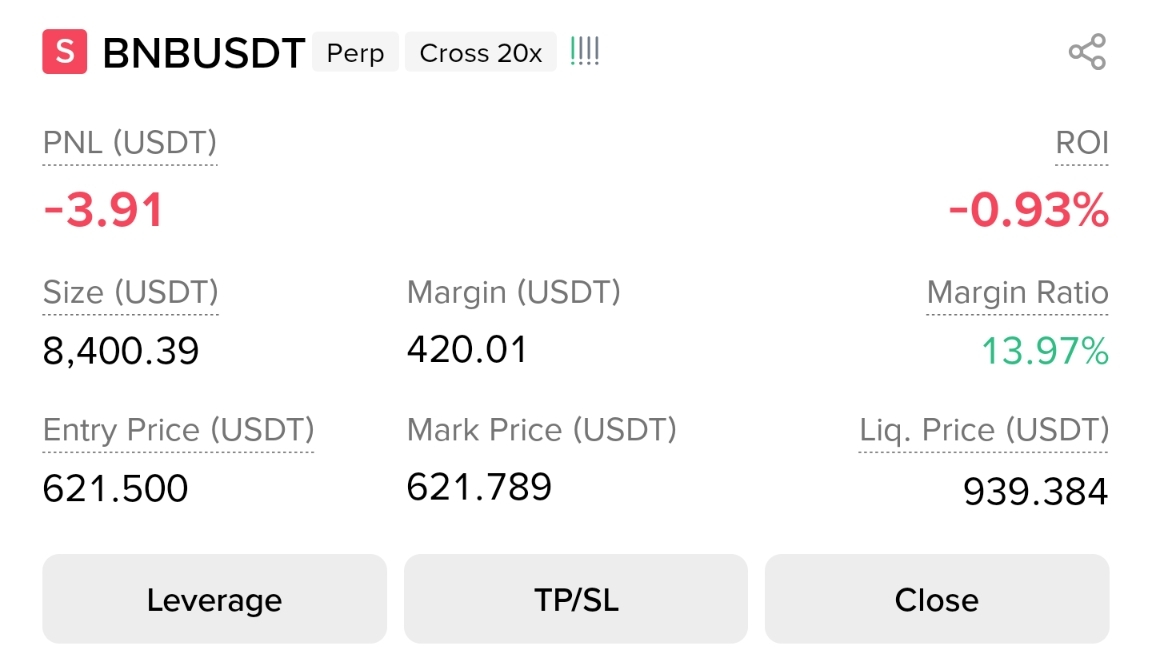
$BNB everyone expecting it to hold support but chart telling different story
trade plan: short $BNB
entry: 620 - 624
stop loss: 635
targets
tp1: 612
tp2: 605
tp3: 595 and above
move sl to entry after tp1
bnb showing clear lower high and lower low structure on small time frames. recent bounce look weak and it just look like simple relief move before another drop come. if sellers keep control below 630 then down side pressure can continue very quick. we will see if bnb lose the 620 zone and trigger the next leg down.
risk max 1-2
click 👇and short $BNB

BNBUSDT
Perp
628.58
-0.66%