The Relative Strength Index (RSI) is a popular momentum oscillator developed by J. Welles Wilder in 1978. It measures the speed and change of price movements on a scale from 0 to 100, helping traders identify whether an asset (like a stock, crypto, or forex pair) might be overbought (too much buying pressure) or oversold (too much selling pressure).
How RSI Works (Basic Calculation)
RSI compares the magnitude of recent gains to recent losses over a standard period (usually 14 periods — e.g., 14 days on a daily chart, 14 candles on a 15-minute chart, etc.).
The formula is:
RSI = 100 - [100 / (1 + RS)]
Where RS (Relative Strength) = Average Gain over the period / Average Loss over the period.
• Gains are positive price changes; losses are negative (taken as absolute values).
• Higher RSI values indicate stronger upward momentum (more/faster gains).
• Lower values indicate stronger downward momentum.
Overbought Signals Explained
An overbought condition occurs when RSI rises to high levels, suggesting the asset has rallied too aggressively in the short term. Buying pressure has been excessive relative to recent history, so the price may be “overextended” and due for a pullback, correction, or even a reversal (especially in ranging markets).
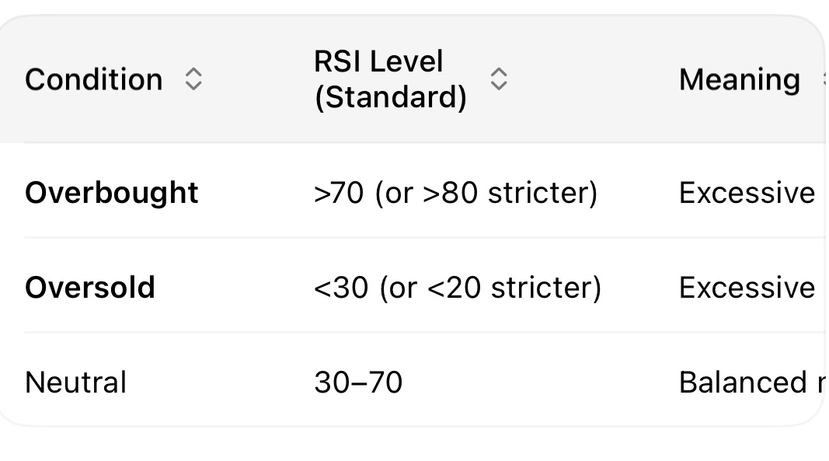
• Standard threshold: RSI above 70 is the classic overbought signal.
• Many traders consider anything >70 as a warning that upward momentum might be unsustainable.
• Some use stricter levels like >80 for very strong signals (common in volatile assets like crypto).
• What it really means: The asset has experienced rapid upward price moves (many consecutive higher closes), so exhaustion among buyers could set in → sellers might step in to take profits.
• Common interpretations and signals:
• RSI crossing above 70 → Potential sell/short signal or warning to avoid new longs.
• RSI crossing back below 70 from above → Often used as a confirmation sell signal (momentum fading).
• In strong uptrends, RSI can stay overbought (>70) for extended periods — the price keeps rising (“overbought can stay overbought”).
• Important caveats:
• Overbought does not guarantee an immediate drop — it’s a momentum warning, not a reversal guarantee.
• In bull markets or during strong pumps (like the recent DEGO surge), RSI can remain >70 while price makes new highs.
• False signals are common in trending markets.
Practical Tips for Using Overbought RSI Signals
• Don’t trade RSI alone — Combine with:
• Price action (e.g., bearish candlestick patterns like shooting stars near resistance).
• Divergences (price makes higher high but RSI makes lower high → bearish divergence, strong reversal signal).
• Trend context (in strong uptrends, ignore overbought; in ranges, respect it more).
• Volume (fading volume on highs strengthens overbought signal).
• Timeframe matters — On a 15-minute chart (like your DEGO example), overbought can lead to quick intraday pullbacks. On daily/weekly, it’s more significant for swings.
• Adjust levels if needed — For highly volatile assets (e.g., altcoins), some traders use 80/20 instead of 70/30 to reduce whipsaws.
• Real-world example context — In explosive moves like DEGO’s recent pump, RSI likely hit overbought (>70 or even >80) during the vertical rise, signaling risk of a short-term correction even as the daily candle stayed massively green.
RSI overbought signals are useful for spotting potential exhaustion but work best as part of a broader strategy. Always use stop-losses, as momentum can persist longer than expected (“the market can remain irrational longer than you can remain solvent”). If you’re looking at a specific chart (e.g., current DEGO RSI value), feel free to share more details!