MACD Divergence is one of the most powerful (and reliable) signals the MACD indicator provides. It occurs when price action and the MACD (usually the MACD line or histogram) move in opposite directions, signaling that momentum is weakening and a potential trend reversal (or continuation in the case of hidden divergence) may be coming.
Divergences are stronger reversal signals than simple crossovers because they show underlying momentum loss before the price fully reverses.
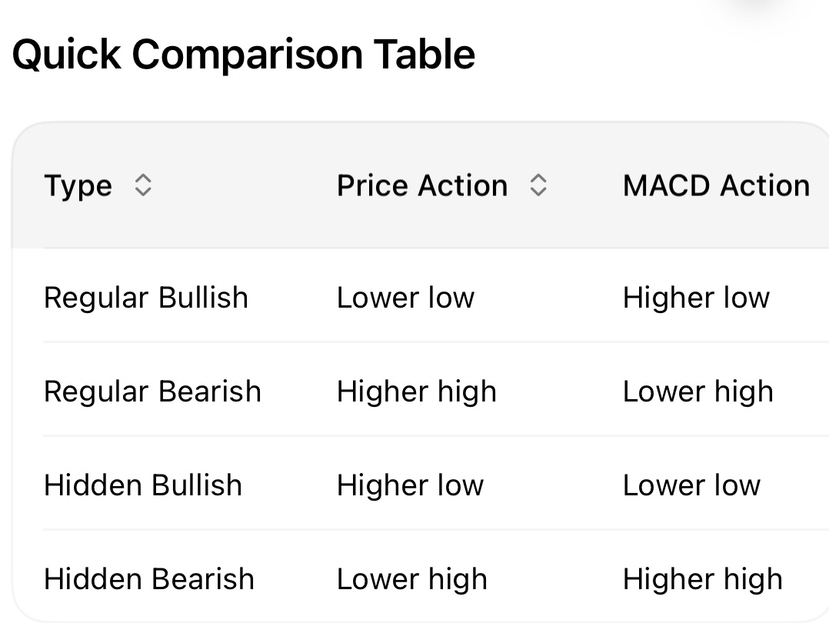
There are two main categories: regular divergence (signals reversal) and hidden divergence (signals continuation). Below are the classic examples.
1. Regular Bullish Divergence (Reversal Signal – Bottoming Out)
• Price action: Makes a lower low (new low point, confirming downtrend continuation).
• MACD: Makes a higher low (MACD does not make a new low; momentum is less negative).
• Meaning: Selling pressure is weakening even though price is still dropping → buyers may step in soon → potential upside reversal.
• Typical setup: Often appears at the end of a downtrend or correction. Traders look for confirmation (e.g., MACD crossover above signal line, price breaking resistance) before going long.
• Strength: Very strong if it occurs near major support, with increasing volume on the bounce.
Visual description (imagine this on a chart):
• Price: Swing low A (higher), then swing low B (lower than A).
• MACD line/histogram: At low A, MACD is deep negative; at low B, MACD is higher (less negative or shallower trough) than at A.
• After divergence, price often rallies sharply.
This is a classic “buy the dip” reversal signal in oversold conditions.
2. Regular Bearish Divergence (Reversal Signal – Topping Out)
• Price action: Makes a higher high (new high point, confirming uptrend continuation).
• MACD: Makes a lower high (MACD does not make a new high; momentum is less positive).
• Meaning: Buying pressure is fading even though price is still rising → sellers may take control → potential downside reversal.
• Typical setup: Often at the end of an uptrend or rally. Look for confirmation like MACD crossing below signal line or price failing at resistance.
• Strength: Stronger in overbought conditions (e.g., combined with RSI >70).
Visual description:
• Price: Swing high A, then swing high B (higher than A).
• MACD: At high A, MACD is strongly positive; at high B, MACD peaks lower than at A (shallower peak).
• After divergence, price often pulls back or reverses down.
This warns of “sell the rally” opportunities.
3. Hidden Bullish Divergence (Continuation Signal – Trend Resumption)
• Price action: Makes a higher low (pullback in uptrend, but not as deep as previous low).
• MACD: Makes a lower low (MACD dips deeper negative during the pullback).
• Meaning: The pullback is losing steam faster than before → uptrend is likely to resume strongly.
• Use: Traders add to long positions or enter on the bounce.
4. Hidden Bearish Divergence (Continuation Signal – Trend Resumption)
• Price action: Makes a lower high (rally in downtrend, but not as high as previous high).
• MACD: Makes a higher high (MACD peaks higher positive during the rally).
• Meaning: The counter-rally is weakening → downtrend likely to continue.
• Use: Add to shorts or enter on breakdowns.
Tips for Using MACD Divergences Effectively
• Confirm with other tools: Don’t trade divergence alone. Look for price patterns (double bottom/top), support/resistance breaks, volume increase on reversal, or RSI extremes.
• Timeframe matters: Divergences on higher timeframes (e.g., 4H, daily) are more reliable than on very short ones (like 5m/15m), where noise is higher.
• Histogram vs. Line: Many traders prefer divergence on the MACD line (smoother), but histogram divergences work too (e.g., shallower troughs/peaks).
• False signals happen: In strong trends, divergence can appear multiple times before actual reversal (e.g., “overbought can stay overbought”).
• Context from your DEGO chart: In explosive pumps like the recent one, watch for regular bearish divergence near the 0.6835 high — if price made a higher high but MACD showed a lower high, it could have warned of the pullback you saw.
Divergences are among the best ways to catch reversals early. Practice spotting them on historical charts (e.g., TradingView replay mode) to get comfortable! If you want examples applied to a specific asset or timeframe, share more details.