

Key Insights
Fartcoin surged 13% as trading volume jumped nearly 49%, confirming fresh capital inflows and renewed speculative interest across the market.
On-chain data revealed a $155,000 accumulation through multiple swaps, indicating deliberate whale positioning shortly after price rebounded from support levels.
Binance heatmap data shows dense liquidity clusters below price, suggesting markets may target $0.20 levels before any sustained expansion toward higher resistance zones.
Fartcoin climbed 13.46% within 24 hours and traded near $0.2183 as market participation expanded sharply. Market capitalization rose to about $218.36 million while traders returned to the market after a period of reduced volatility.
Trading volume increased 48.77% and reached $48.48 million. The strong growth in turnover showed that fresh capital entered the market during the rally rather than fading momentum.
Buyers defended the $0.20 to $0.21 support range early in the move. Consequently, the price advanced toward the $0.22 region before the upward push began to slow.
Whale Accumulation Signals Calculated Positioning
On-chain activity showed a wallet accumulation of roughly $155,000 shortly after the rally began. The purchases occurred through several swaps, which pointed to deliberate positioning instead of scattered market activity.
Additionally, the timing of the accumulation aligned with the initial breakout from the support zone. That sequence indicated that larger participants stepped in while momentum started to build.
However, price movement slowed once the token approached short-term resistance. The hesitation suggested that technical levels still guide market direction even as demand improves.
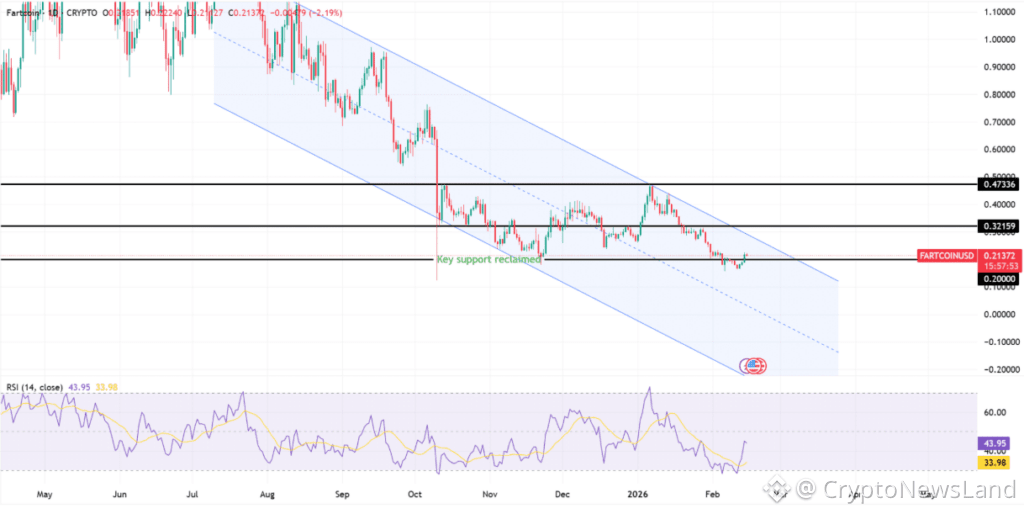
Descending Channel Continues to Shape Market Structure
The broader daily chart still shows Fartcoin trading inside a descending channel that has influenced price behavior for months. Even though bulls regained support near $0.20, the token remains inside those declining boundaries.
The upper trendline continues to restrict stronger advances. Moreover, the chart highlights resistance around $0.32 while a wider supply zone stands near $0.47.
The relative strength index stood at 43 at the time of reporting. This level reflects recovery from previous weakness but still keeps the indicator below the neutral midpoint.
Liquidation Data Shows Leverage Reset
Liquidation data recorded $93,550 in long liquidations compared with $45,830 in short liquidations. The imbalance developed after the rally slowed near the resistance area.
 Source: TradingView
During the surge toward $0.22, short sellers absorbed pressure as prices climbed. However, once momentum cooled, several late long positions faced forced exits.
Consequently, the data suggests that leverage in the market began to normalize after the rapid price expansion.
The Binance FARTCOIN USDT liquidation heatmap revealed dense leverage clusters between $0.208 and $0.210. These zones sit just beneath the current trading level near $0.212.
Moreover, additional liquidity bands extend toward the $0.19 to $0.20 region. These concentrations often attract price movement during consolidation phases.
Liquidity above the market appears thinner between $0.22 and $0.23. Hence, the imbalance indicates stronger downside targets compared with overhead squeeze levels.