This week I see no clean BTC entry signal, so I’m staying patient and trading only short-term with smaller positions. My long-term Bitcoin holdings and DCA plan remain unchanged.
1️⃣ What I See on the Chart
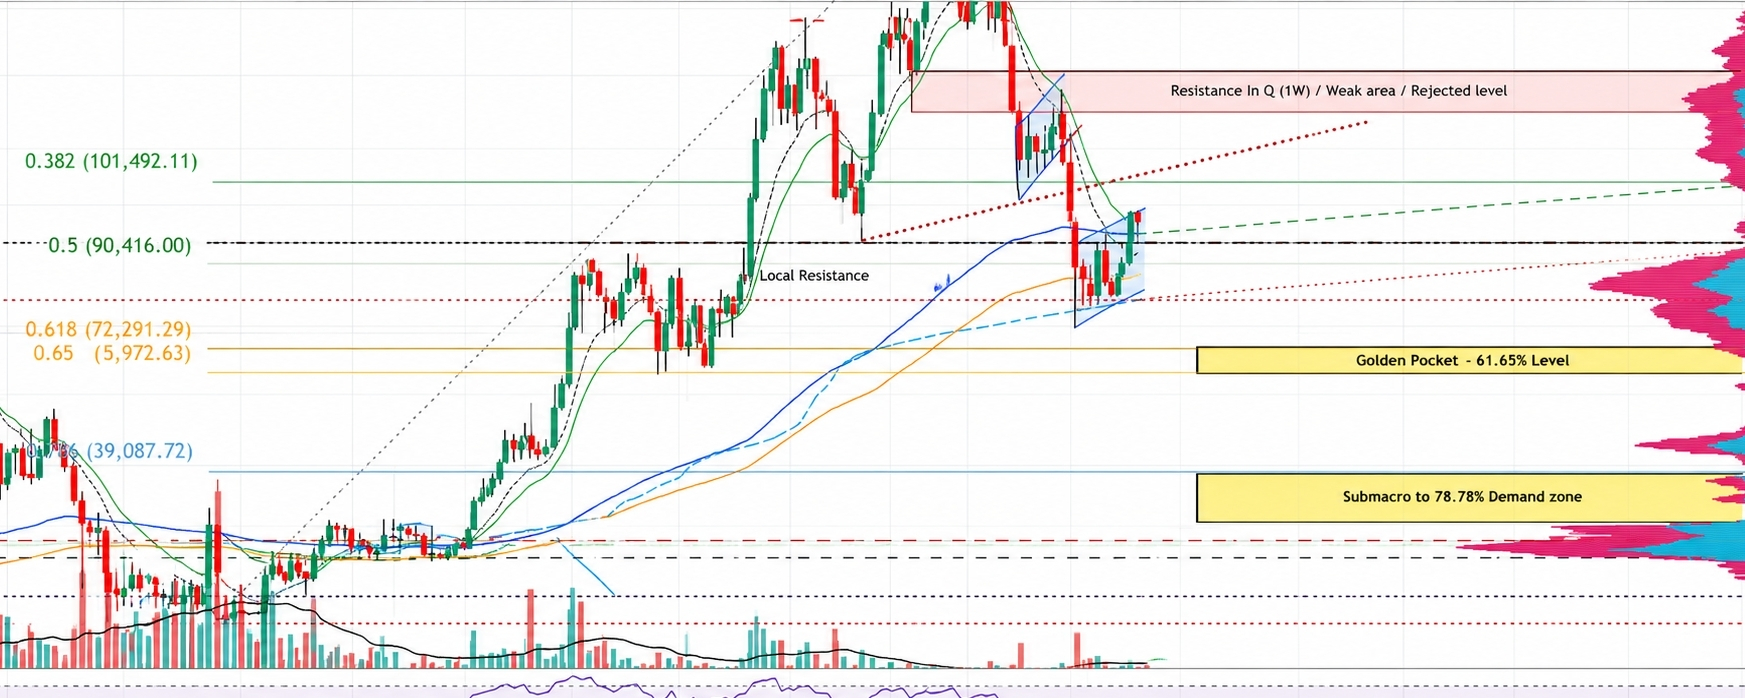
For the first time since October 2025, Bitcoin closed a weekly candle back above the key $73,835 level (March 2024 high), which had been lost earlier this year. Price is now retesting that zone from above.
That sounds positive — but I remain cautious for 3 reasons:
• Recent green weekly candles came with low volume. Strong rallies usually need strong participation.
• Futures data shows sellers have been paying buyers for around 47 days, one of the longest streaks ever. That can mean short covering rather than real demand.
• The weekly EMA150 sits right inside the current test zone. If it holds, bullish. If it fails, sideways movement likely continues.
2️⃣ What Supports Bitcoin
• US spot Bitcoin ETFs saw around $2.4B inflows over the last month.
• Large institutions continue accumulating.
• Long-term holders appear to be buying again after prior distribution.
3️⃣ What Creates Risk
• Middle East tensions remain elevated.
• Oil prices stay high.
• US inflation is sticky.
• Fed policy uncertainty continues.
Bitcoin still trades like a risk asset in macro stress environments, even if this cycle has shown more resilience than previous ones.
4️⃣ Three Possible Paths
A) Sideways (most likely now)
BTC ranges between $67K–$80K until a clear catalyst appears.
B) Upside continuation
Support holds, ETF inflows dominate. But real breakout zone remains $90K–$100K.
C) Downside move
First support: $67K–$68K
Next zone: $53K–$57K
Bearish extreme: $40K
5️⃣ What I’m Doing
• Long-term holdings unchanged
• DCA continues
• Short-term positions reduced sharply
• Waiting for confirmation before acting
Patience costs little right now. Impulsive trades can cost a lot.
Personal opinion only. Not financial advice.
